Features
Before you can begin gating or training models, you need to have cell features. CellTune computes a rich set of features for every cell. This section introduces where these features come from, what they represent, and how they integrate into the rest of the workflow.
CellTune Spatial Features
CellTune performs an expanded feature extraction step, computing many more features than standard approaches to capture spatial expression patterns useful for classification. Each feature is derived from a channel and can represent single protein expression, protein colocalization, composites of proteins, or subregions. Only protein expression features are required
Subregion features provide contextual histological information via pixel classifiers (e.g., smooth muscle vasculature masks to distinguish fibroblasts from vascular smooth muscle cells).
- These can be manually prepared or generated with pixel classification tools like Ilastik and QuPath. (Under development is incorporating all of these into the GUI)
For each feature image, CellTune computes four statistical measures—mean, maximum, variance, and pixel count—across distinct spatial compartments: cell center (erode), entire cell, immediate surroundings (dilate), and broader environment. See our manuscript for more info.
Optional marker positivity probability features can be computed using a CNN and incorporated. In total, ~2,000 features per cell are generated depending on the number of channels, then merged into the cell table.
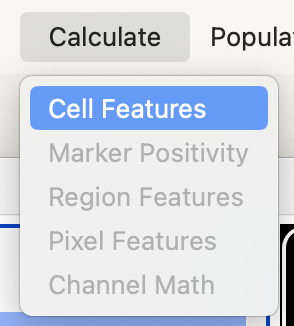
Calculate Cell Features
To calculate features go to the menu:
This will open the dialog where you can select channels to calculate features on, edit transformation factor, image scale, and number of cores to use when processing.
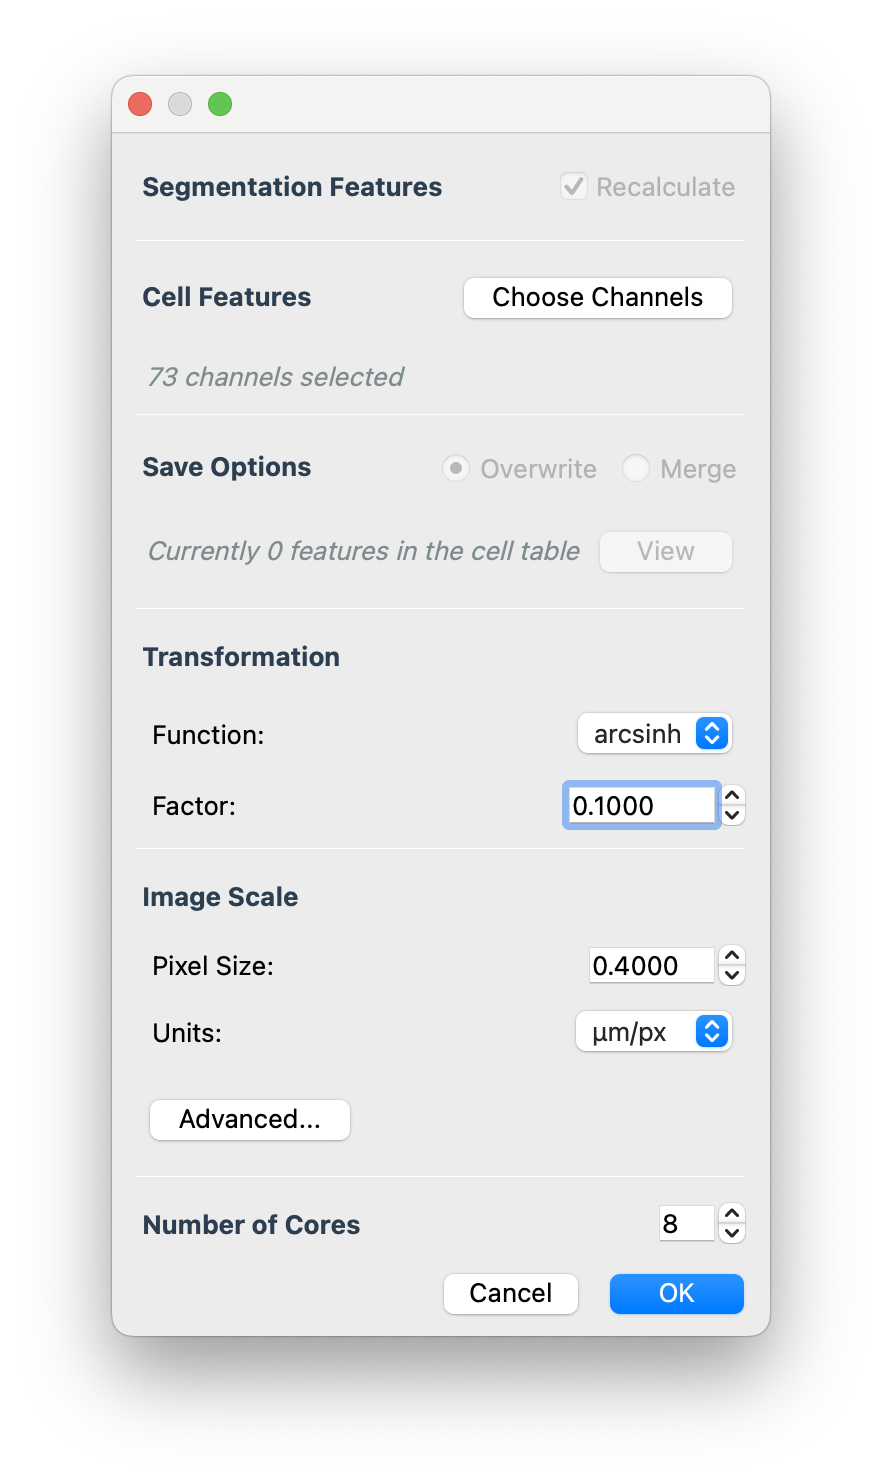
- For the arcsinh transformation factor we typically use 0.1 for fluorescence images (CODEX, COMET) and 100 for mass-based images (MIBI, IMC).
- You need to put the image pixel size in manually at this time
- It is currently recommended to use 16 cores or less for very large images.
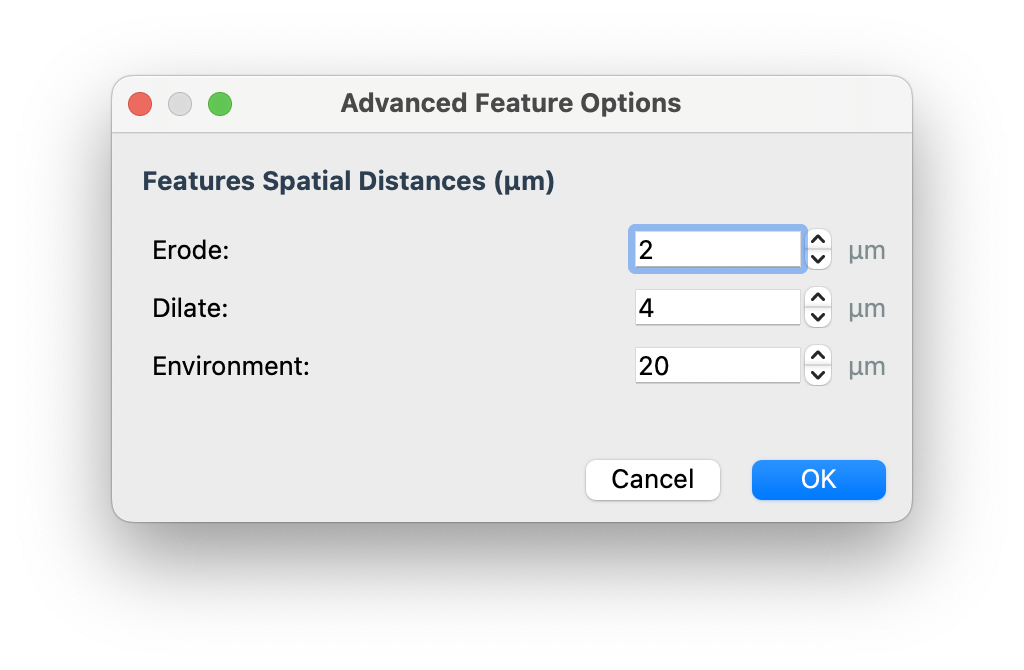
In the advanced features you can control the distance (microns) at which erode and dilate features are calculated at:
Select OK to calculate. It will take some time… you should see a progress bar:
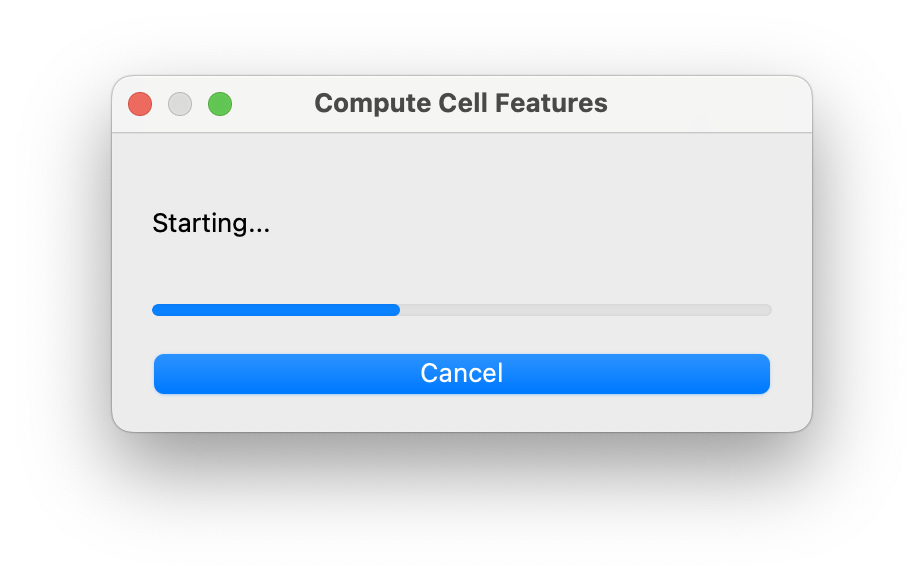
Please note- our progress bars are currently being overhauled, so you may encounter the progress not showing updates properly - do not worry it is still working.
When finished you will see the following message:
See the tutorial for an example
Create Feature Group
It is very useful to save a group of features for use in many contexts (e.g. plotting histograms, clustering, hover feature viewing).
To create a feature group go to the menu:

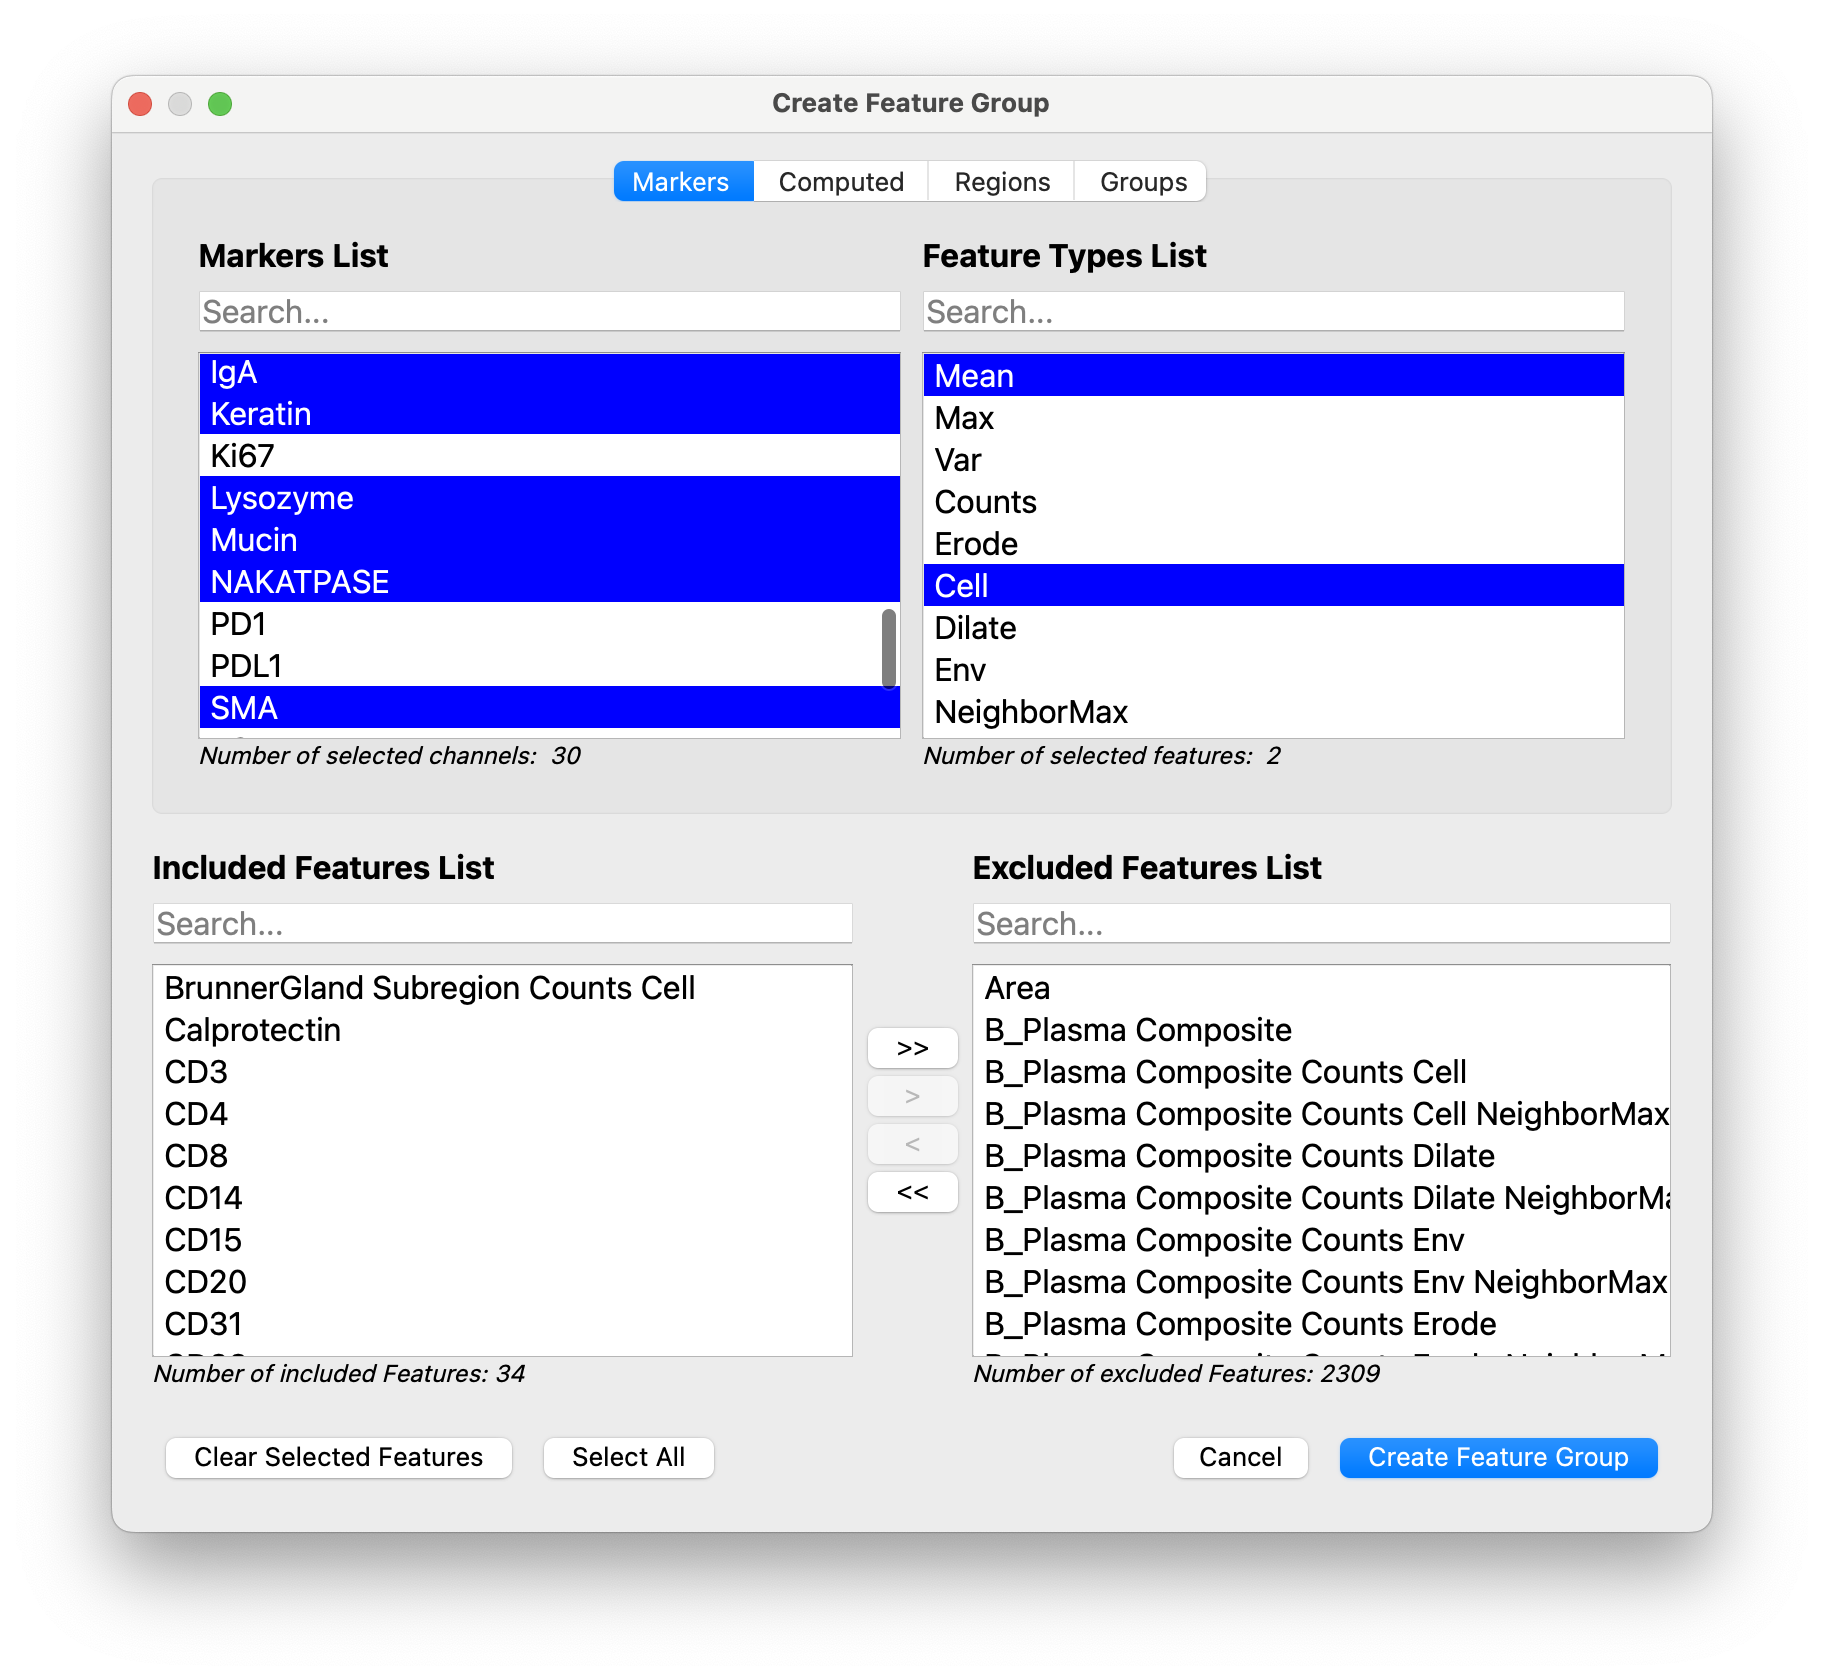
We usually save a Lineage group of features, which includes the Mean Cell expression for lineage channels.
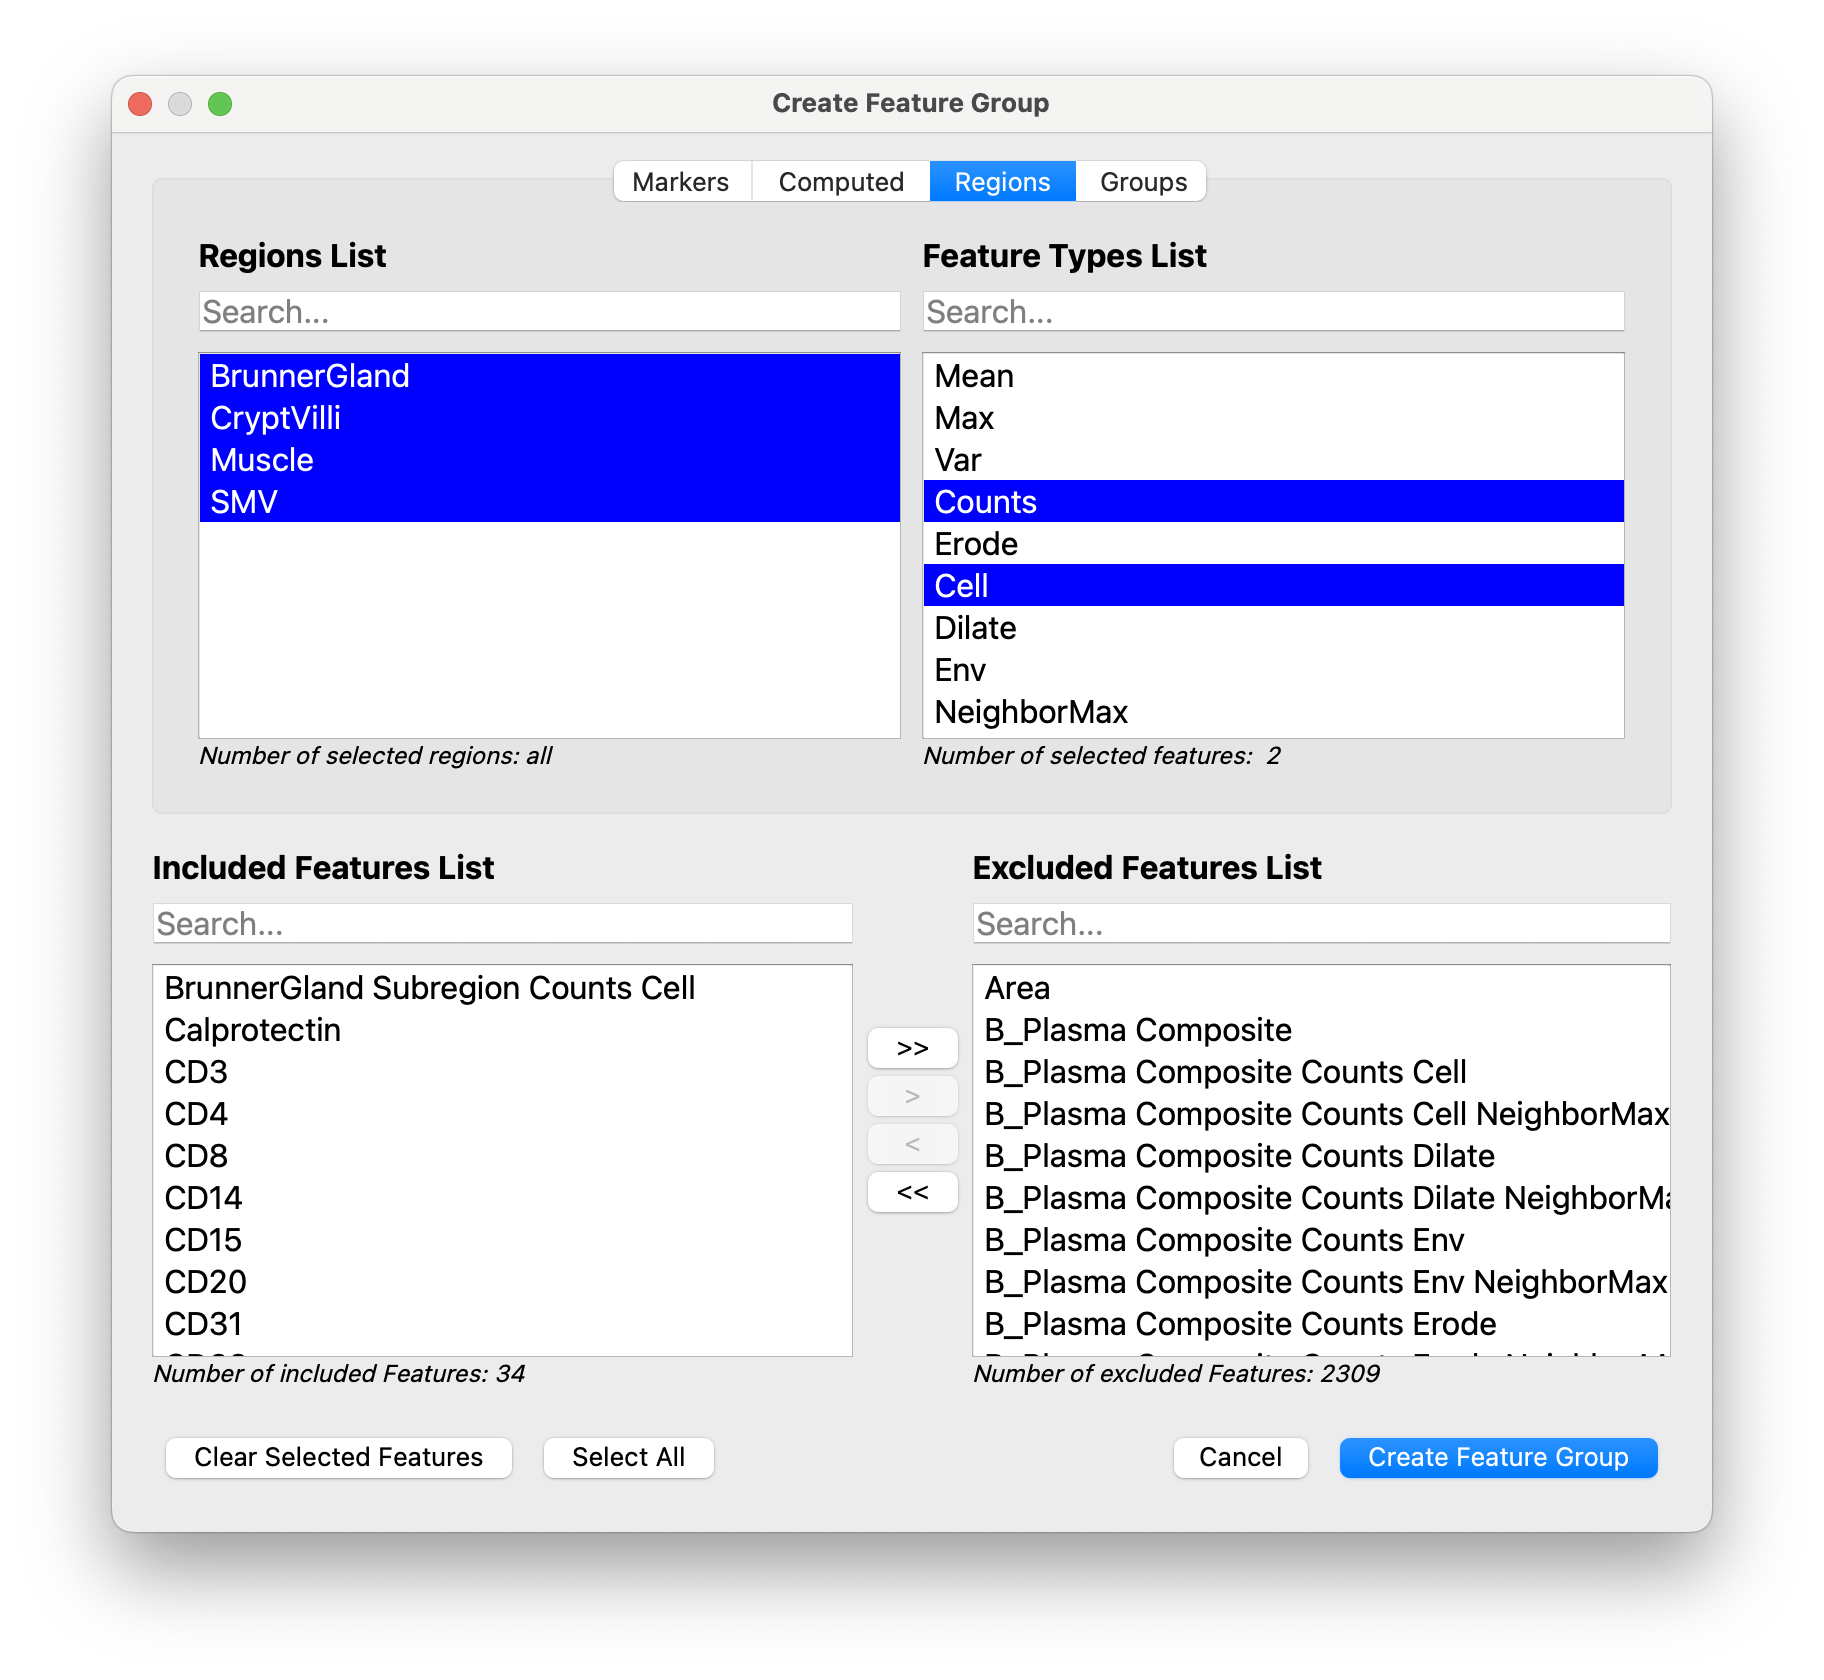
… as well as the Counts Cell features for any important subregions:
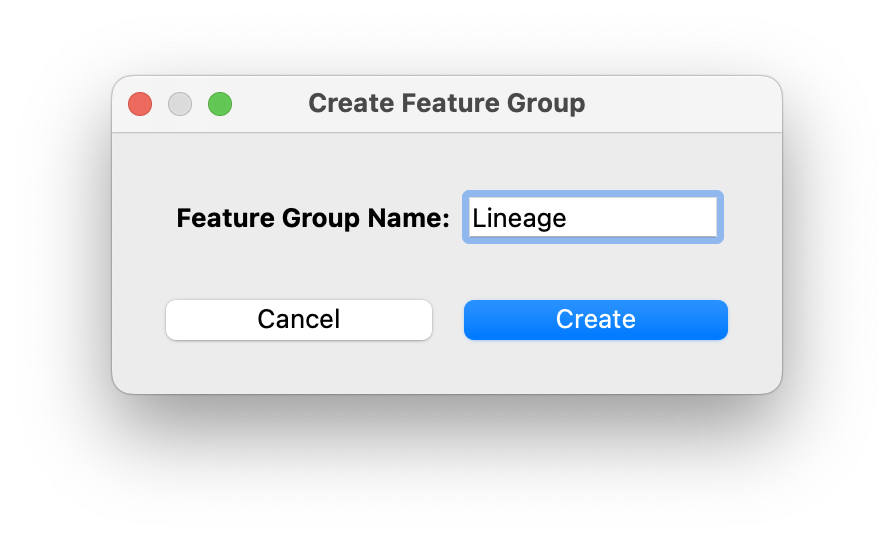
Click Create Feature Group to accept. This will open a window where you can give the feature group a name:
and finally when done you will get the following message: