Plot Classifier Confusions
After training, we can look at the confusion matrix of the predictions between the two models.
- Select your classifier from the classification pane.
- Click on
Plot Confusionsin the classification panel.- Then you can decide if you want to exclude any images from the confusion matrix.
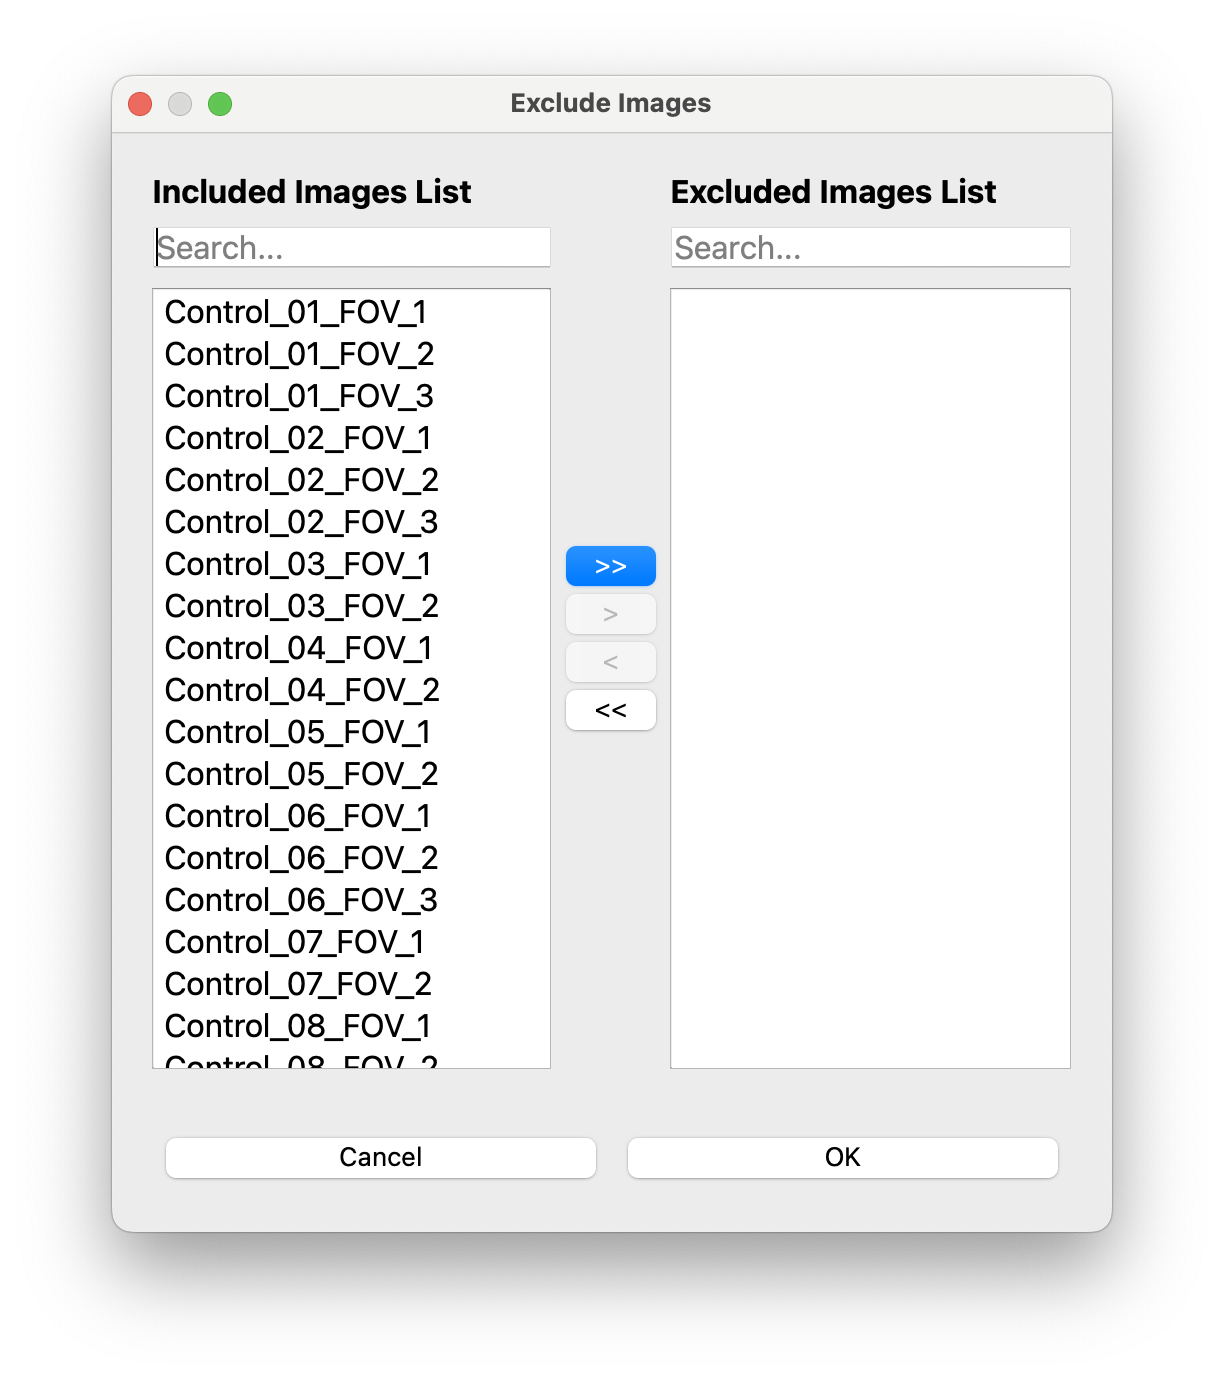
-
Click
OKand the confusion matrix will be generated: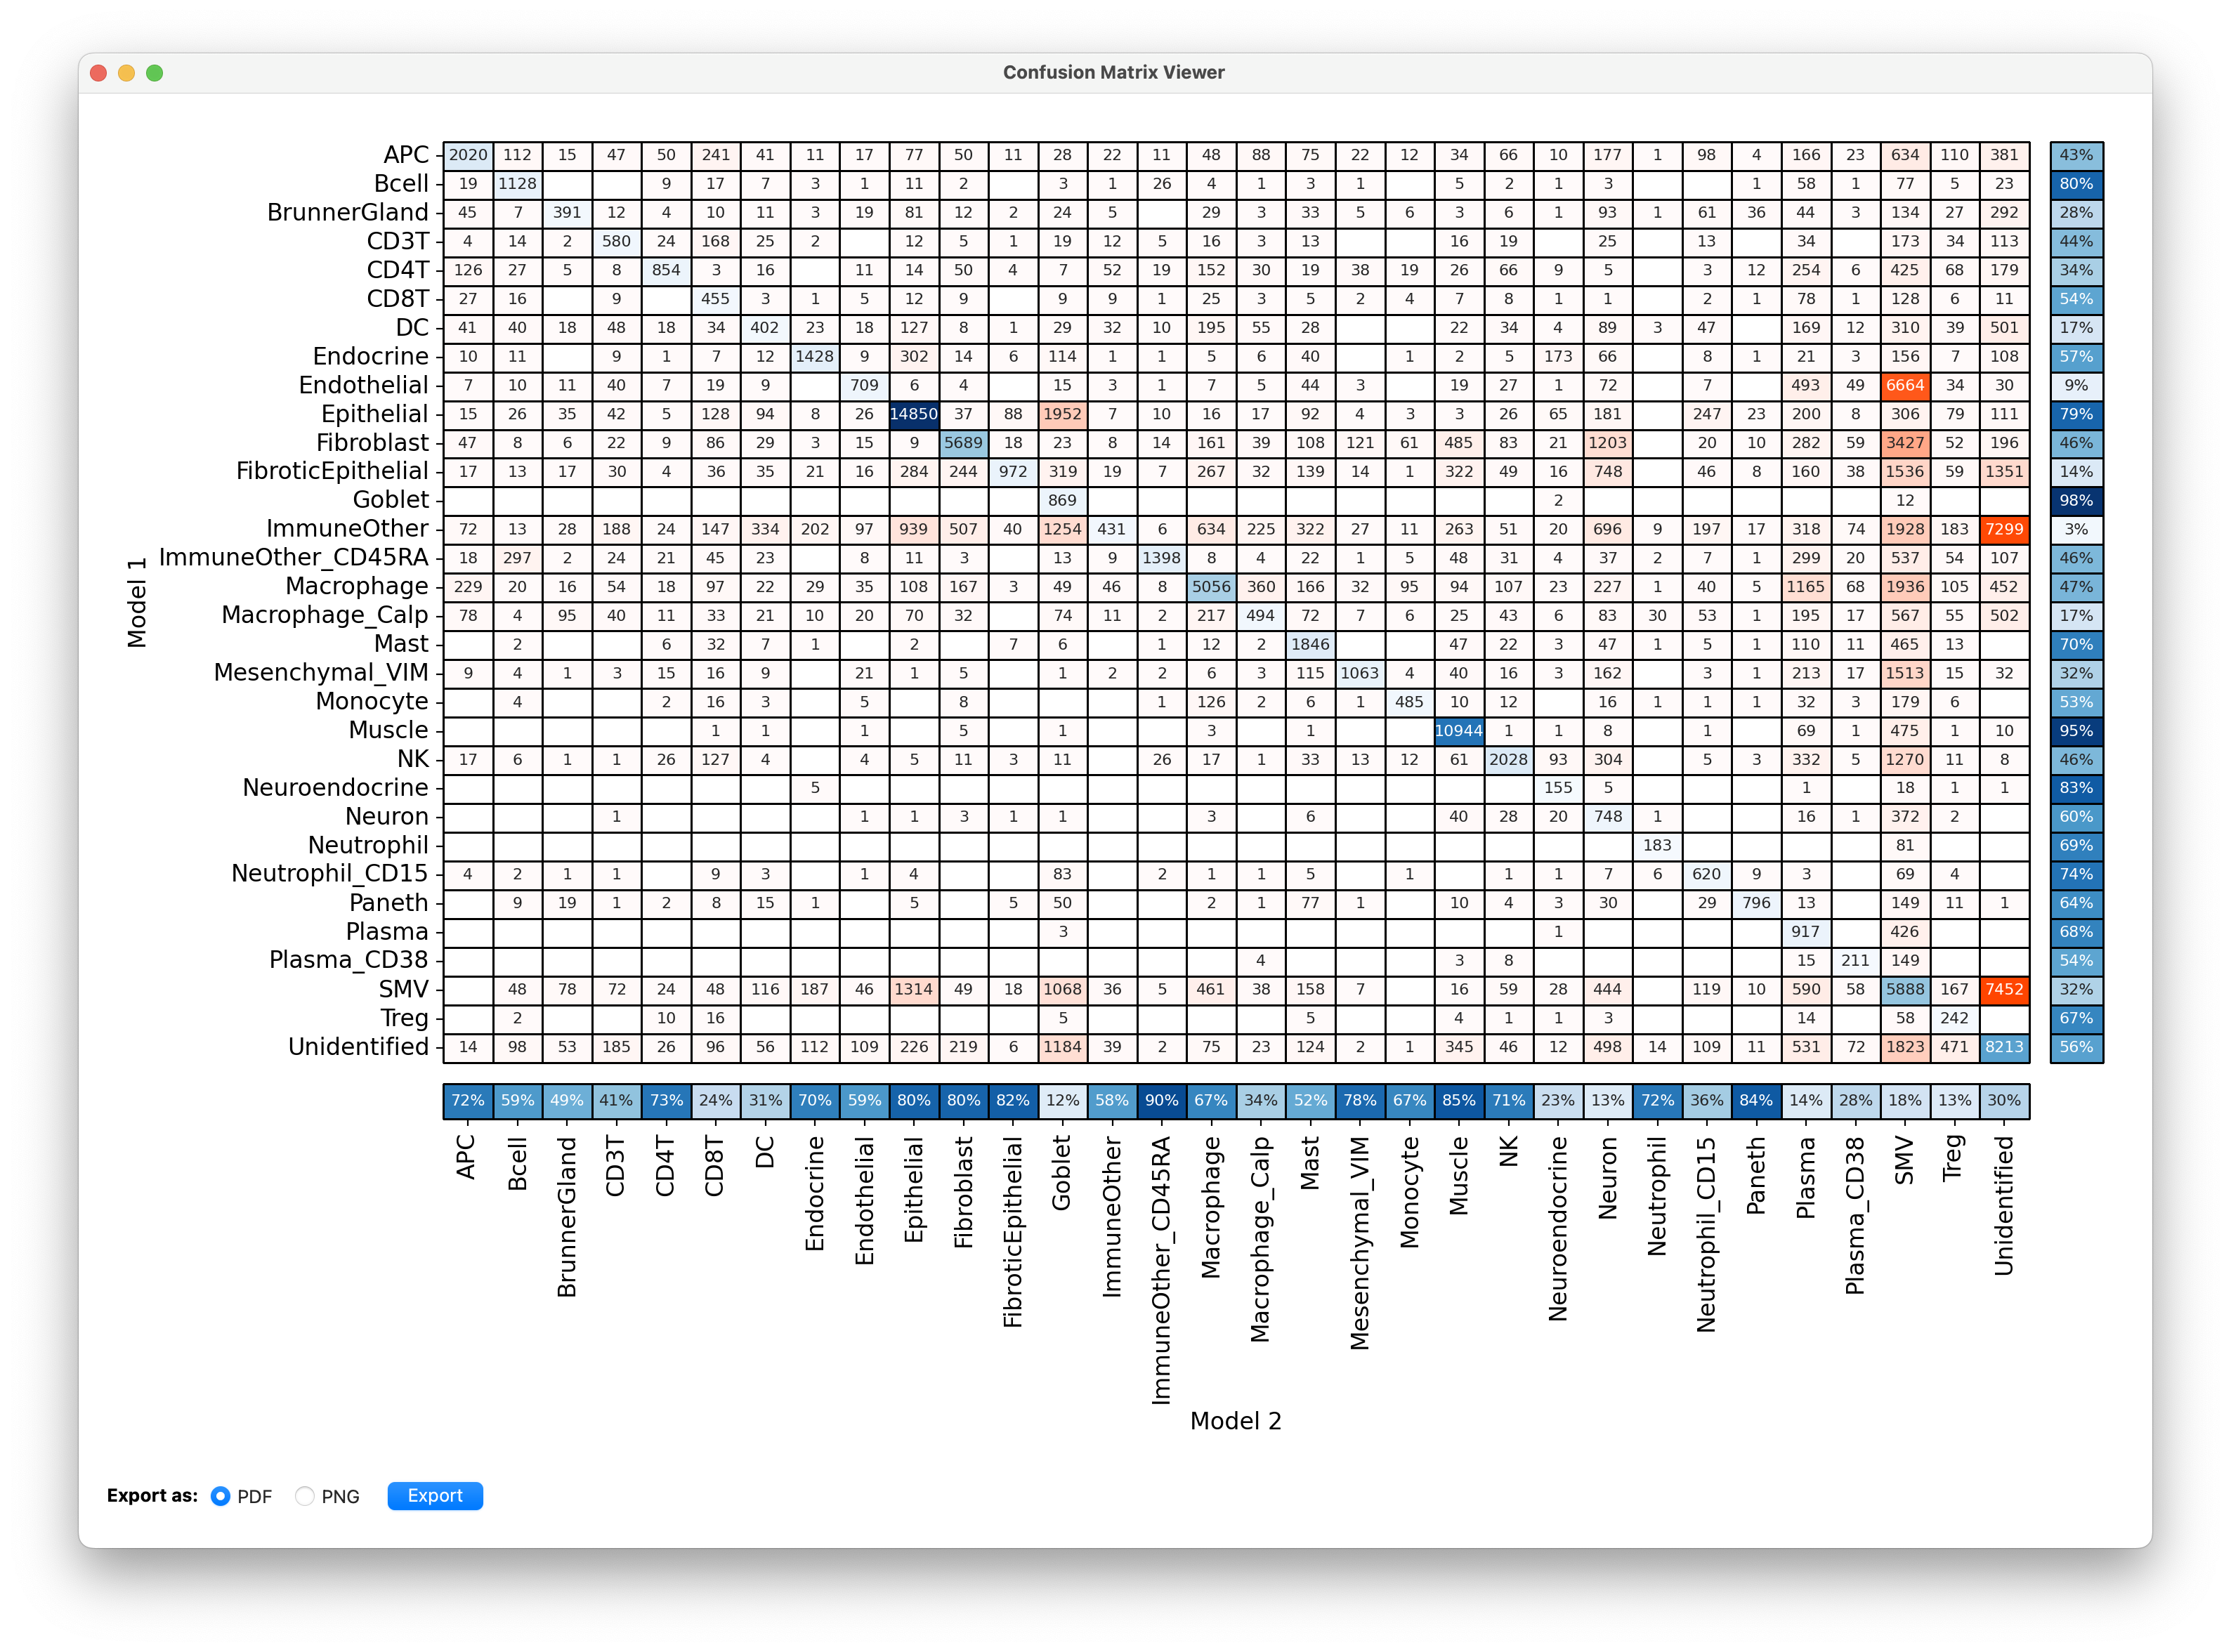
- You can export the confusion matrix as a
.pdfor.png.
- The predictions for model 1 are on the y-axis and predictions for model 2 are on the x-axis.
- The column of percentages on the right side of the plot shows for the cells that model 1 predicted as cell type X the fraction where model 2 also said X. For example, 80% of cells that model 1 predicted to be Bcell were also predicted to be Bcell by model 2.
- The row of percentages at the bottom is the same but for model 2. So 59% of cells that model 2 predicted to be Bcell were also predicted to be Bcell by model 1.
- Do not be startled by low numbers in the beginning, as you train cycles the two models will learn and converge.
- This plot can give you an idea of the most difficult cell types to classify or the most frequent confusions.
- By default CellTune takes these values into account when sampling. It tries to balance agreement across cell types by sampling more from disagreements where one of the predictions is of a cell type with low agreement.