Phenotyping
In CellTune, we distinguish cell types from phenotypes as follows:
-
CellTypes represent lineage or identity (e.g., T cells, macrophages, fibroblasts). These don’t typically change for a cell.
-
Phenotypes represent state, function, or activation within a given cell type (e.g., exhausted CD8 T cells, proliferating tumor cells, etc).
Today, the state-of-the-art approach to study phenotypes is to cluster cells within each cell type and interpret those subclusters as phenotype subtypes - the following subsection shows how to do that clustering in CellTune.
Phenotype Clustering (Subpopulations)
You can select a subset of populations and cluster them alone, to generate the population you want to. For example, you can gate on CD8 and create a population of CD8+ cells, then cluster those cells only.
This can be helpful to see subsets of populations that are not seen when clustering all of the cells together.
-
Typically we start by plotting an expression heatmap of our current populations including all markers to identify which are the relevant functional markers for a specific celltype.
-
Then we create a feature group for each celltype, including only its relevant functional markers:
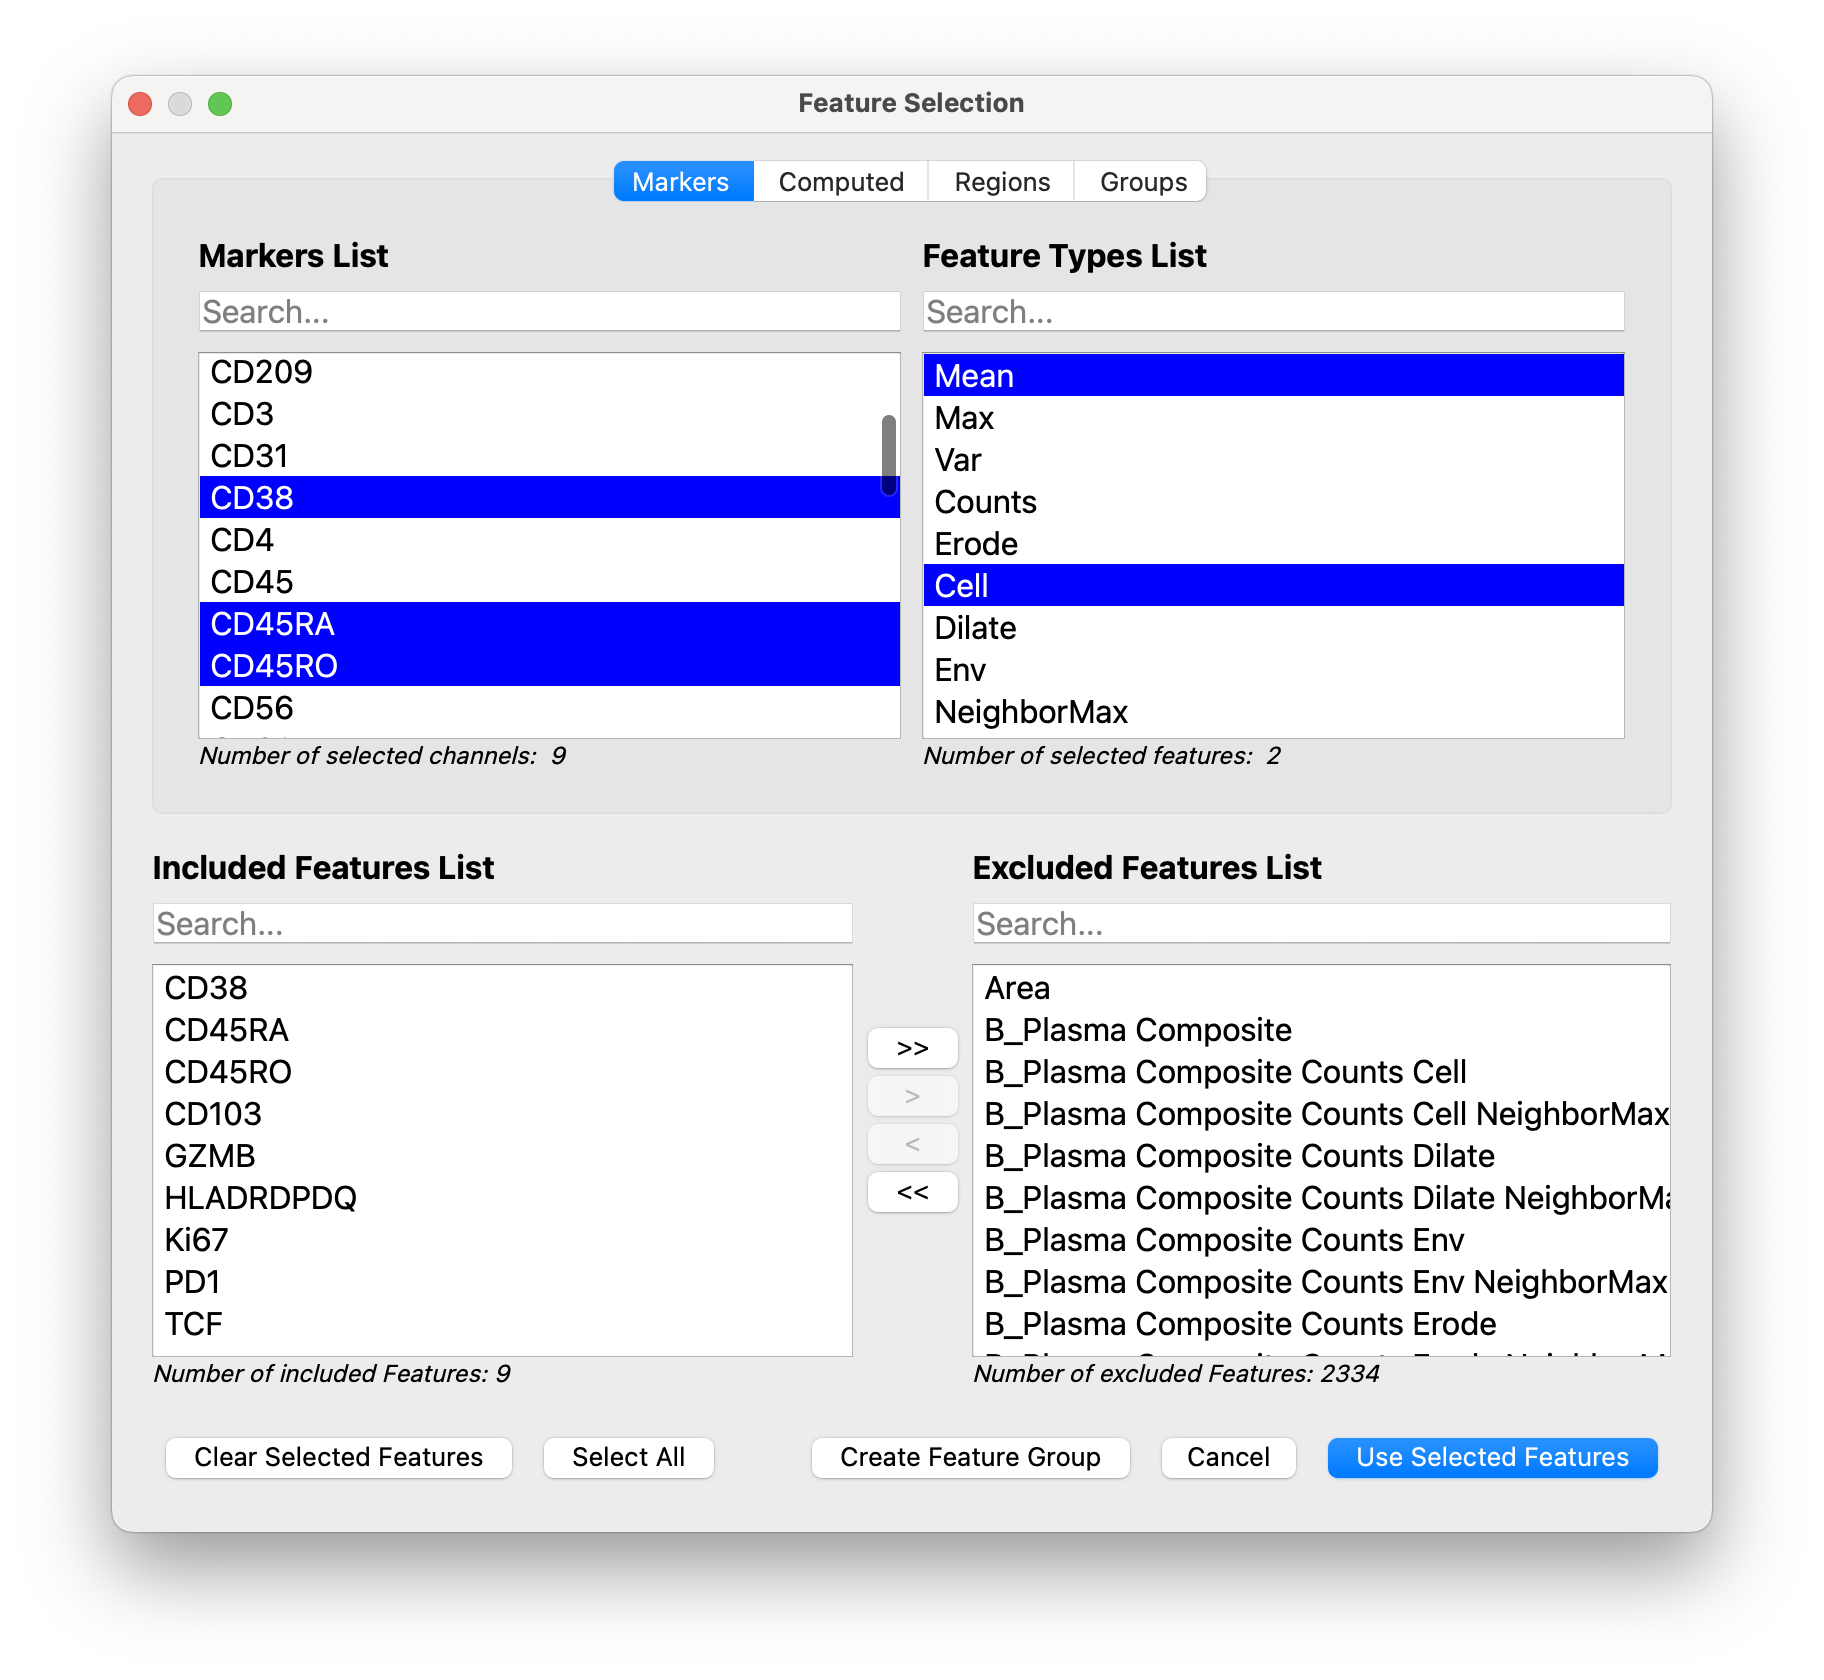
-
Next we open the clustering dialog and filter the populations for the population of interest (here it is CD8T):
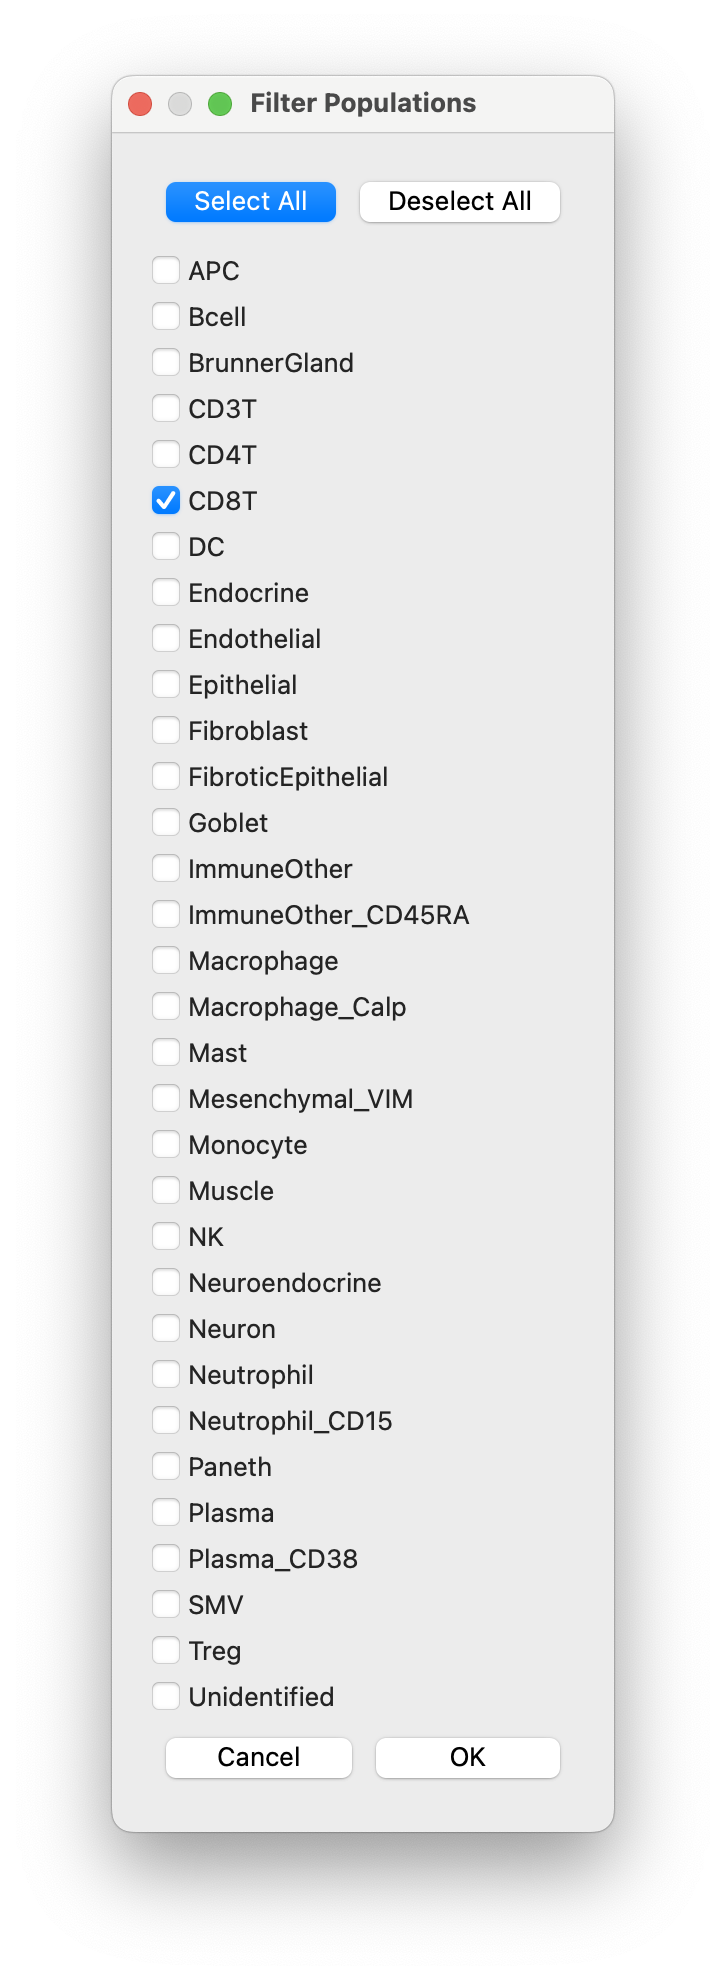
-
We select the functional feature group we created, and give our clustering population set a name
CD8T_Clustersand clickOKto run the clustering.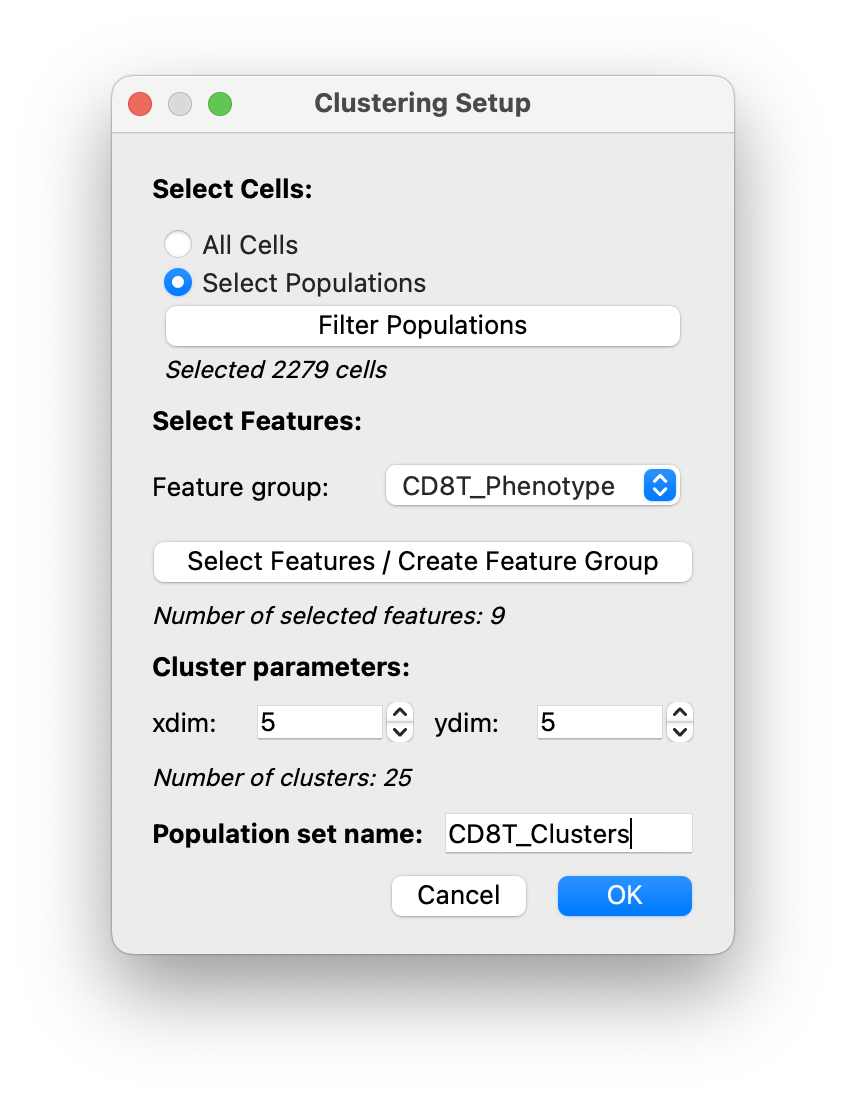
-
Then your clusters will be generated and will open in the Populations Panel.
You can then view your CD8T clusters by hiding the channels:
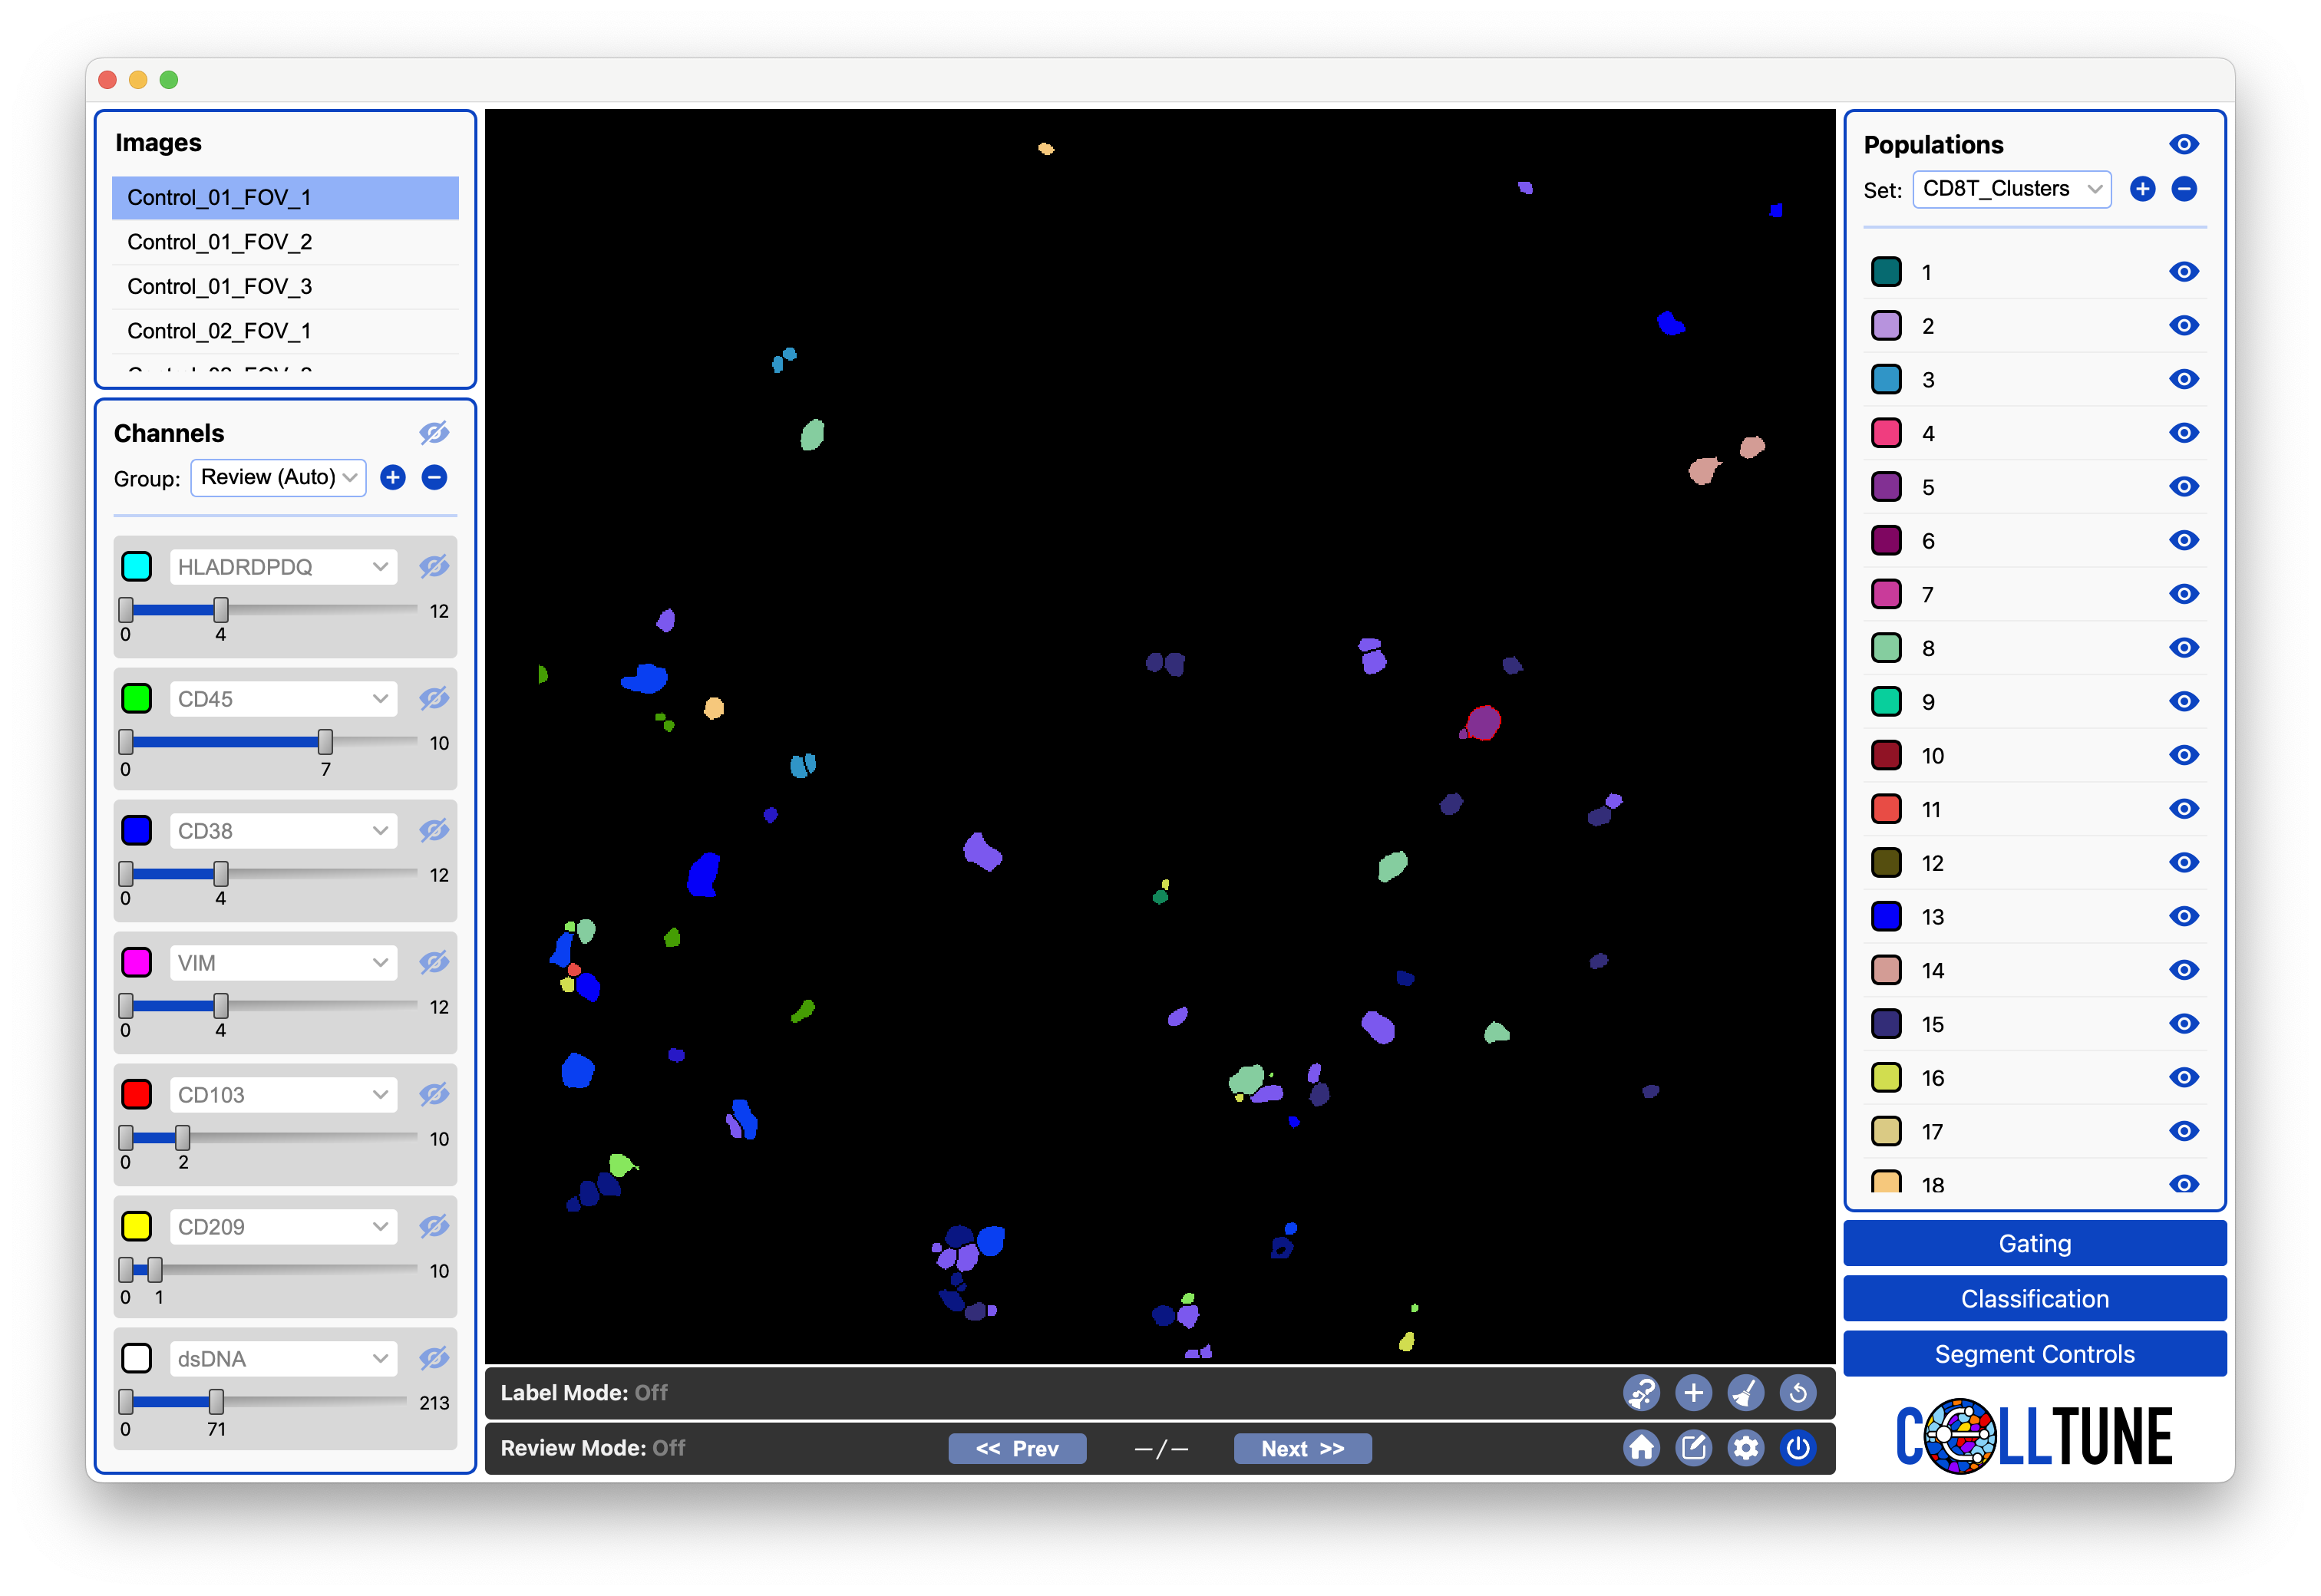
-
Next you can plot a heatmap of expression of the CD8T clusters.
Open the dialog from the main menu (Plot -> Plot expression).
Select the
CD8T_Phenotypefeature group in the dialog: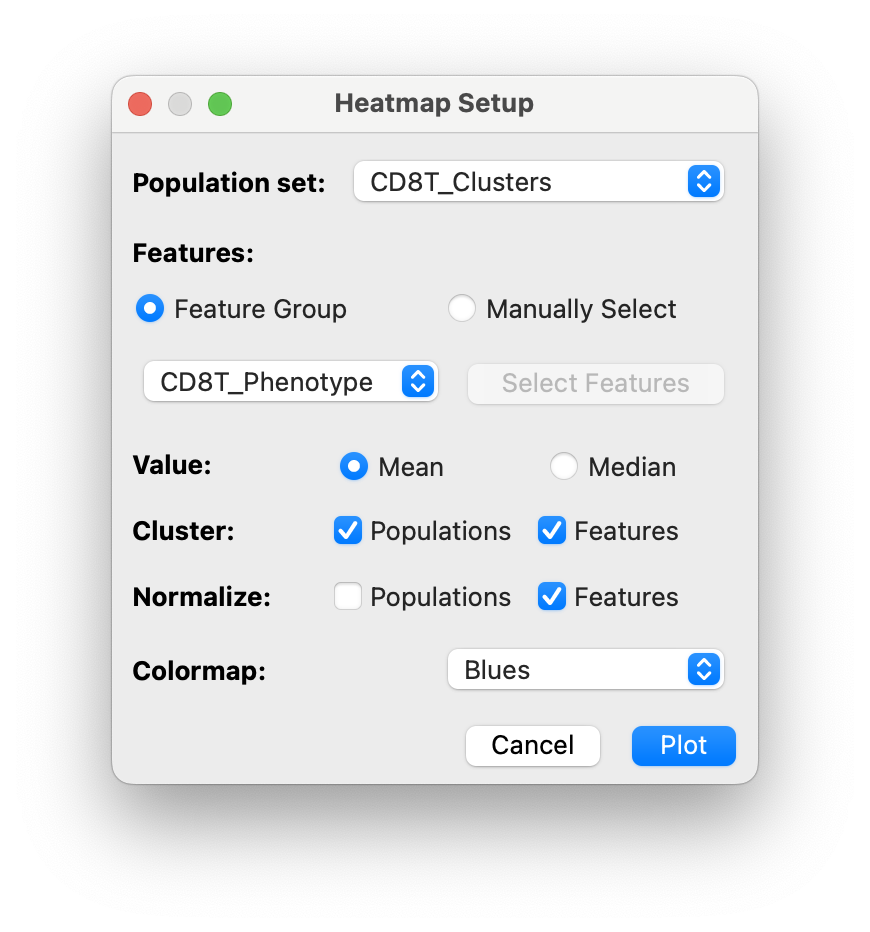
And click
Plot. -
This will open a heatmap of CD8T cells clustered by functional markers:
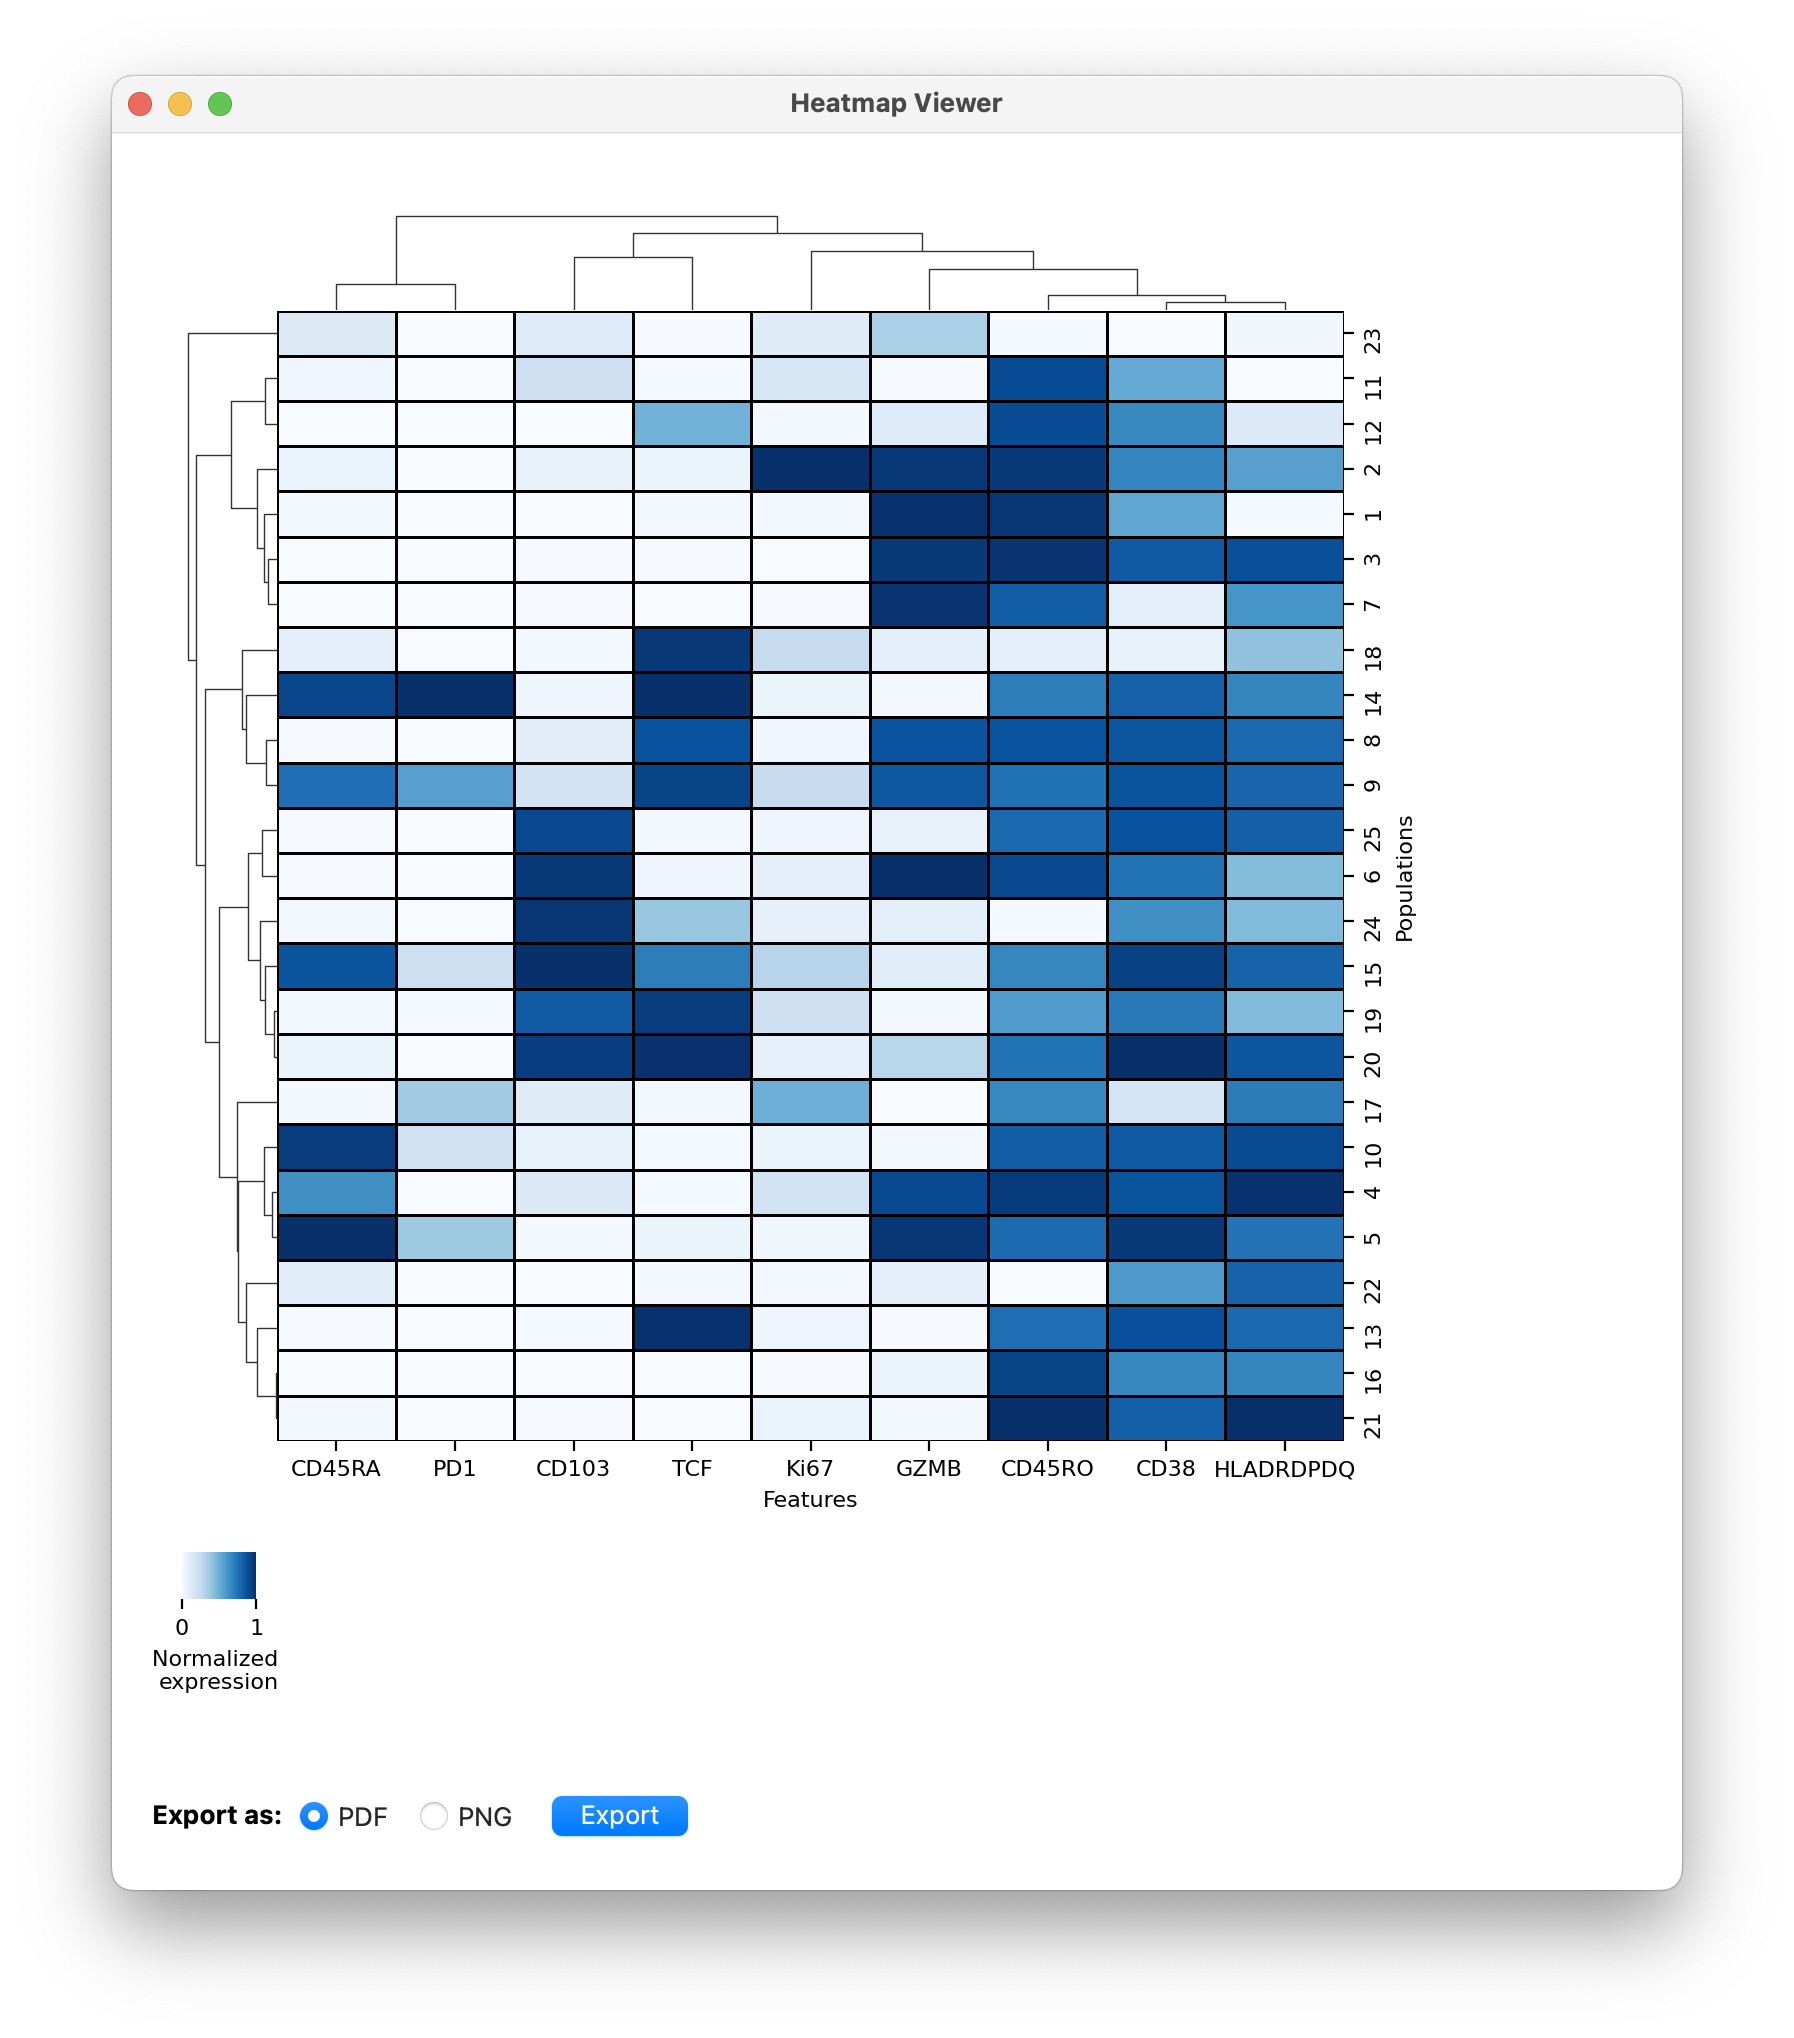
- You can go through these clusters and give them names (Under development).
- You can also export these populations for further downstream analysis.