Initial Clustering
CellTune provides unsupervised clustering to reveal structure in the data and highlight distinct cell populations. The purpose of this step is straightforward: discover the cell types (both expected and novel), examine their expression profiles (e.g., mean cluster expression), and use this information to update your CellTypeTable.
Importantly, the goal is not to use initial clusters as final classifications (their accuracy is limited), but rather to identify celltypes present in the data and, if needed, sample and review cells from each cluster to establish landmarks for initial classification training.
CellTune uses flowSOM (Self-organized maps) unsupervised clustering.
Run Clustering
Select clustering from the classification menu bar:
A dialog will open where you can adjust the clustering settings:
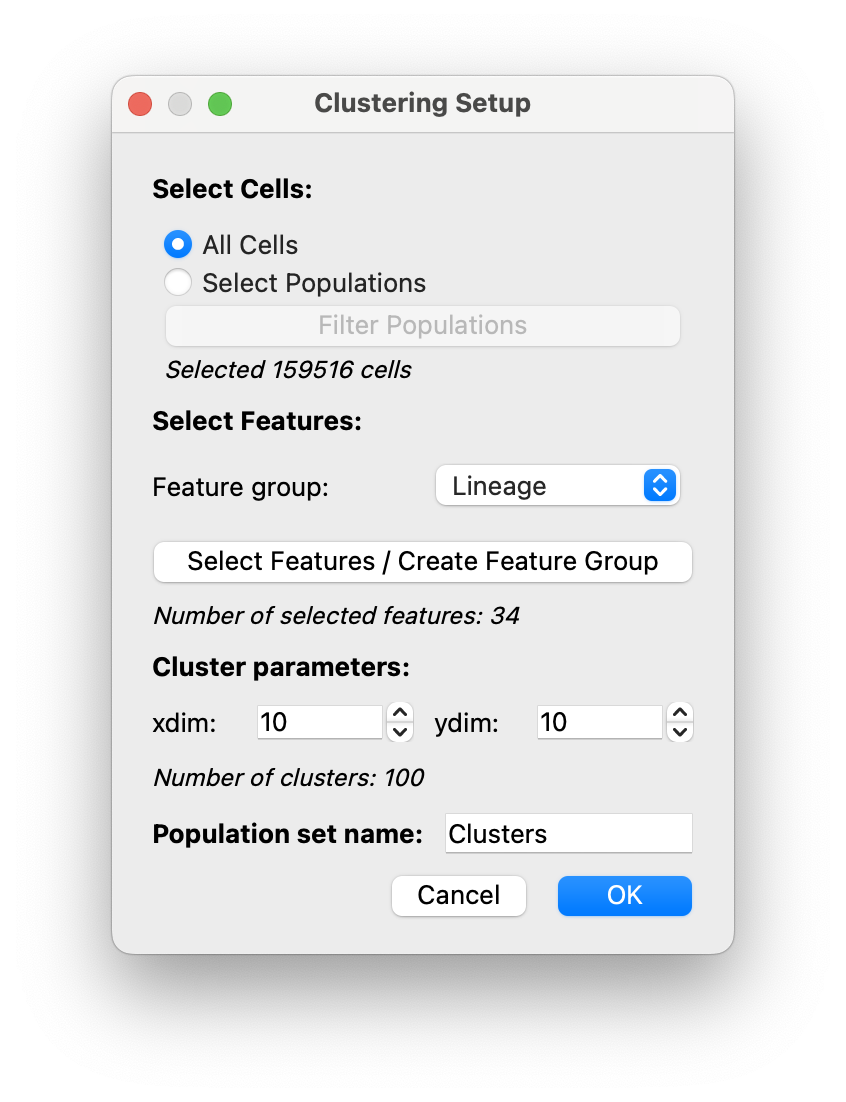
Select Cells: If you currently have populations, you can click on the radio button forSelect Populationsto perform clustering to generate subgroups of populations, see example below. Otherwise, click onAll Cells.Select Features: Select features that will be used for clustering.
As seen previously in the hover legend, it is recommended to create aLineagefeature group and select it here.Cluster parameters: Determine the number of clusters (= xdim * ydim). The number of clusters shown below will update if you adjust them.Population set name: Give a name for your clustering population set (Here we choseClusters)
Click OK and clustering will run.
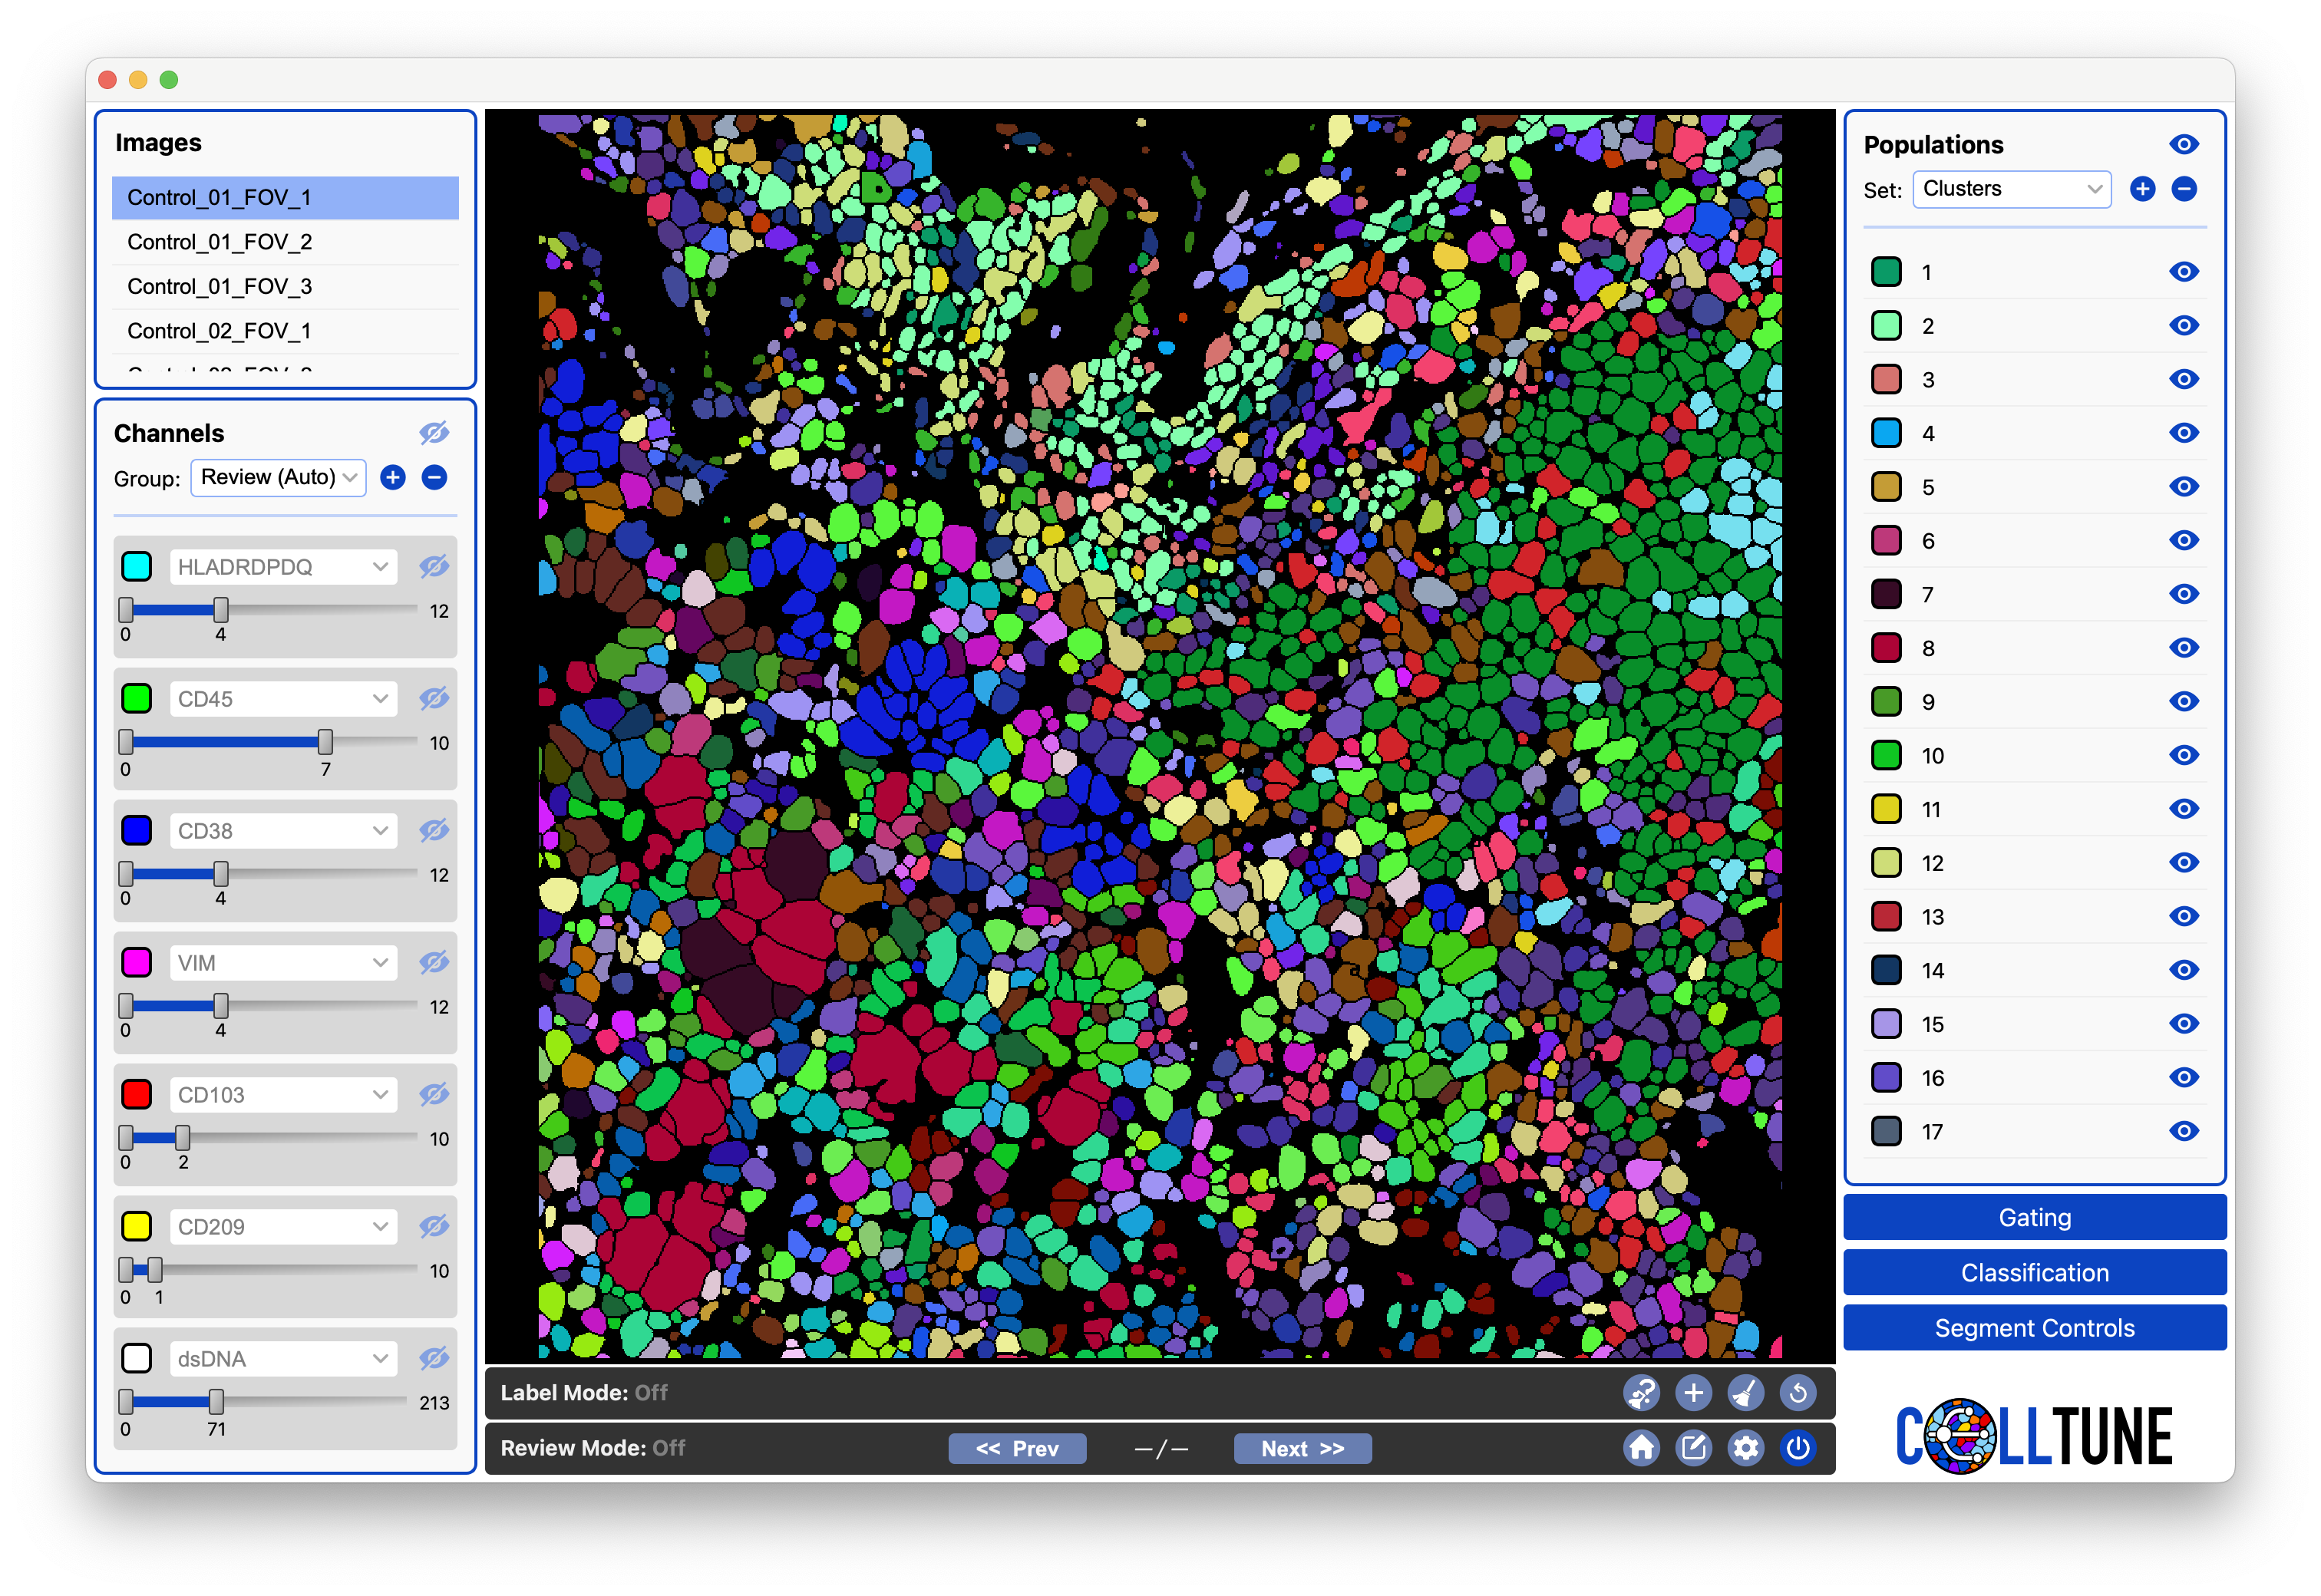
Next, the clusters will be loaded into the Populations Panel and you can visualize them:
Plot Heatmap
Aside from visualizing clusters in the viewer, it is helpful to look at a heatmap of mean expression of the cells in each cluster.
Following the instructions from the Plot Expression Documentation You can generate a heatmap of mean cluster expression of the lineage markers:
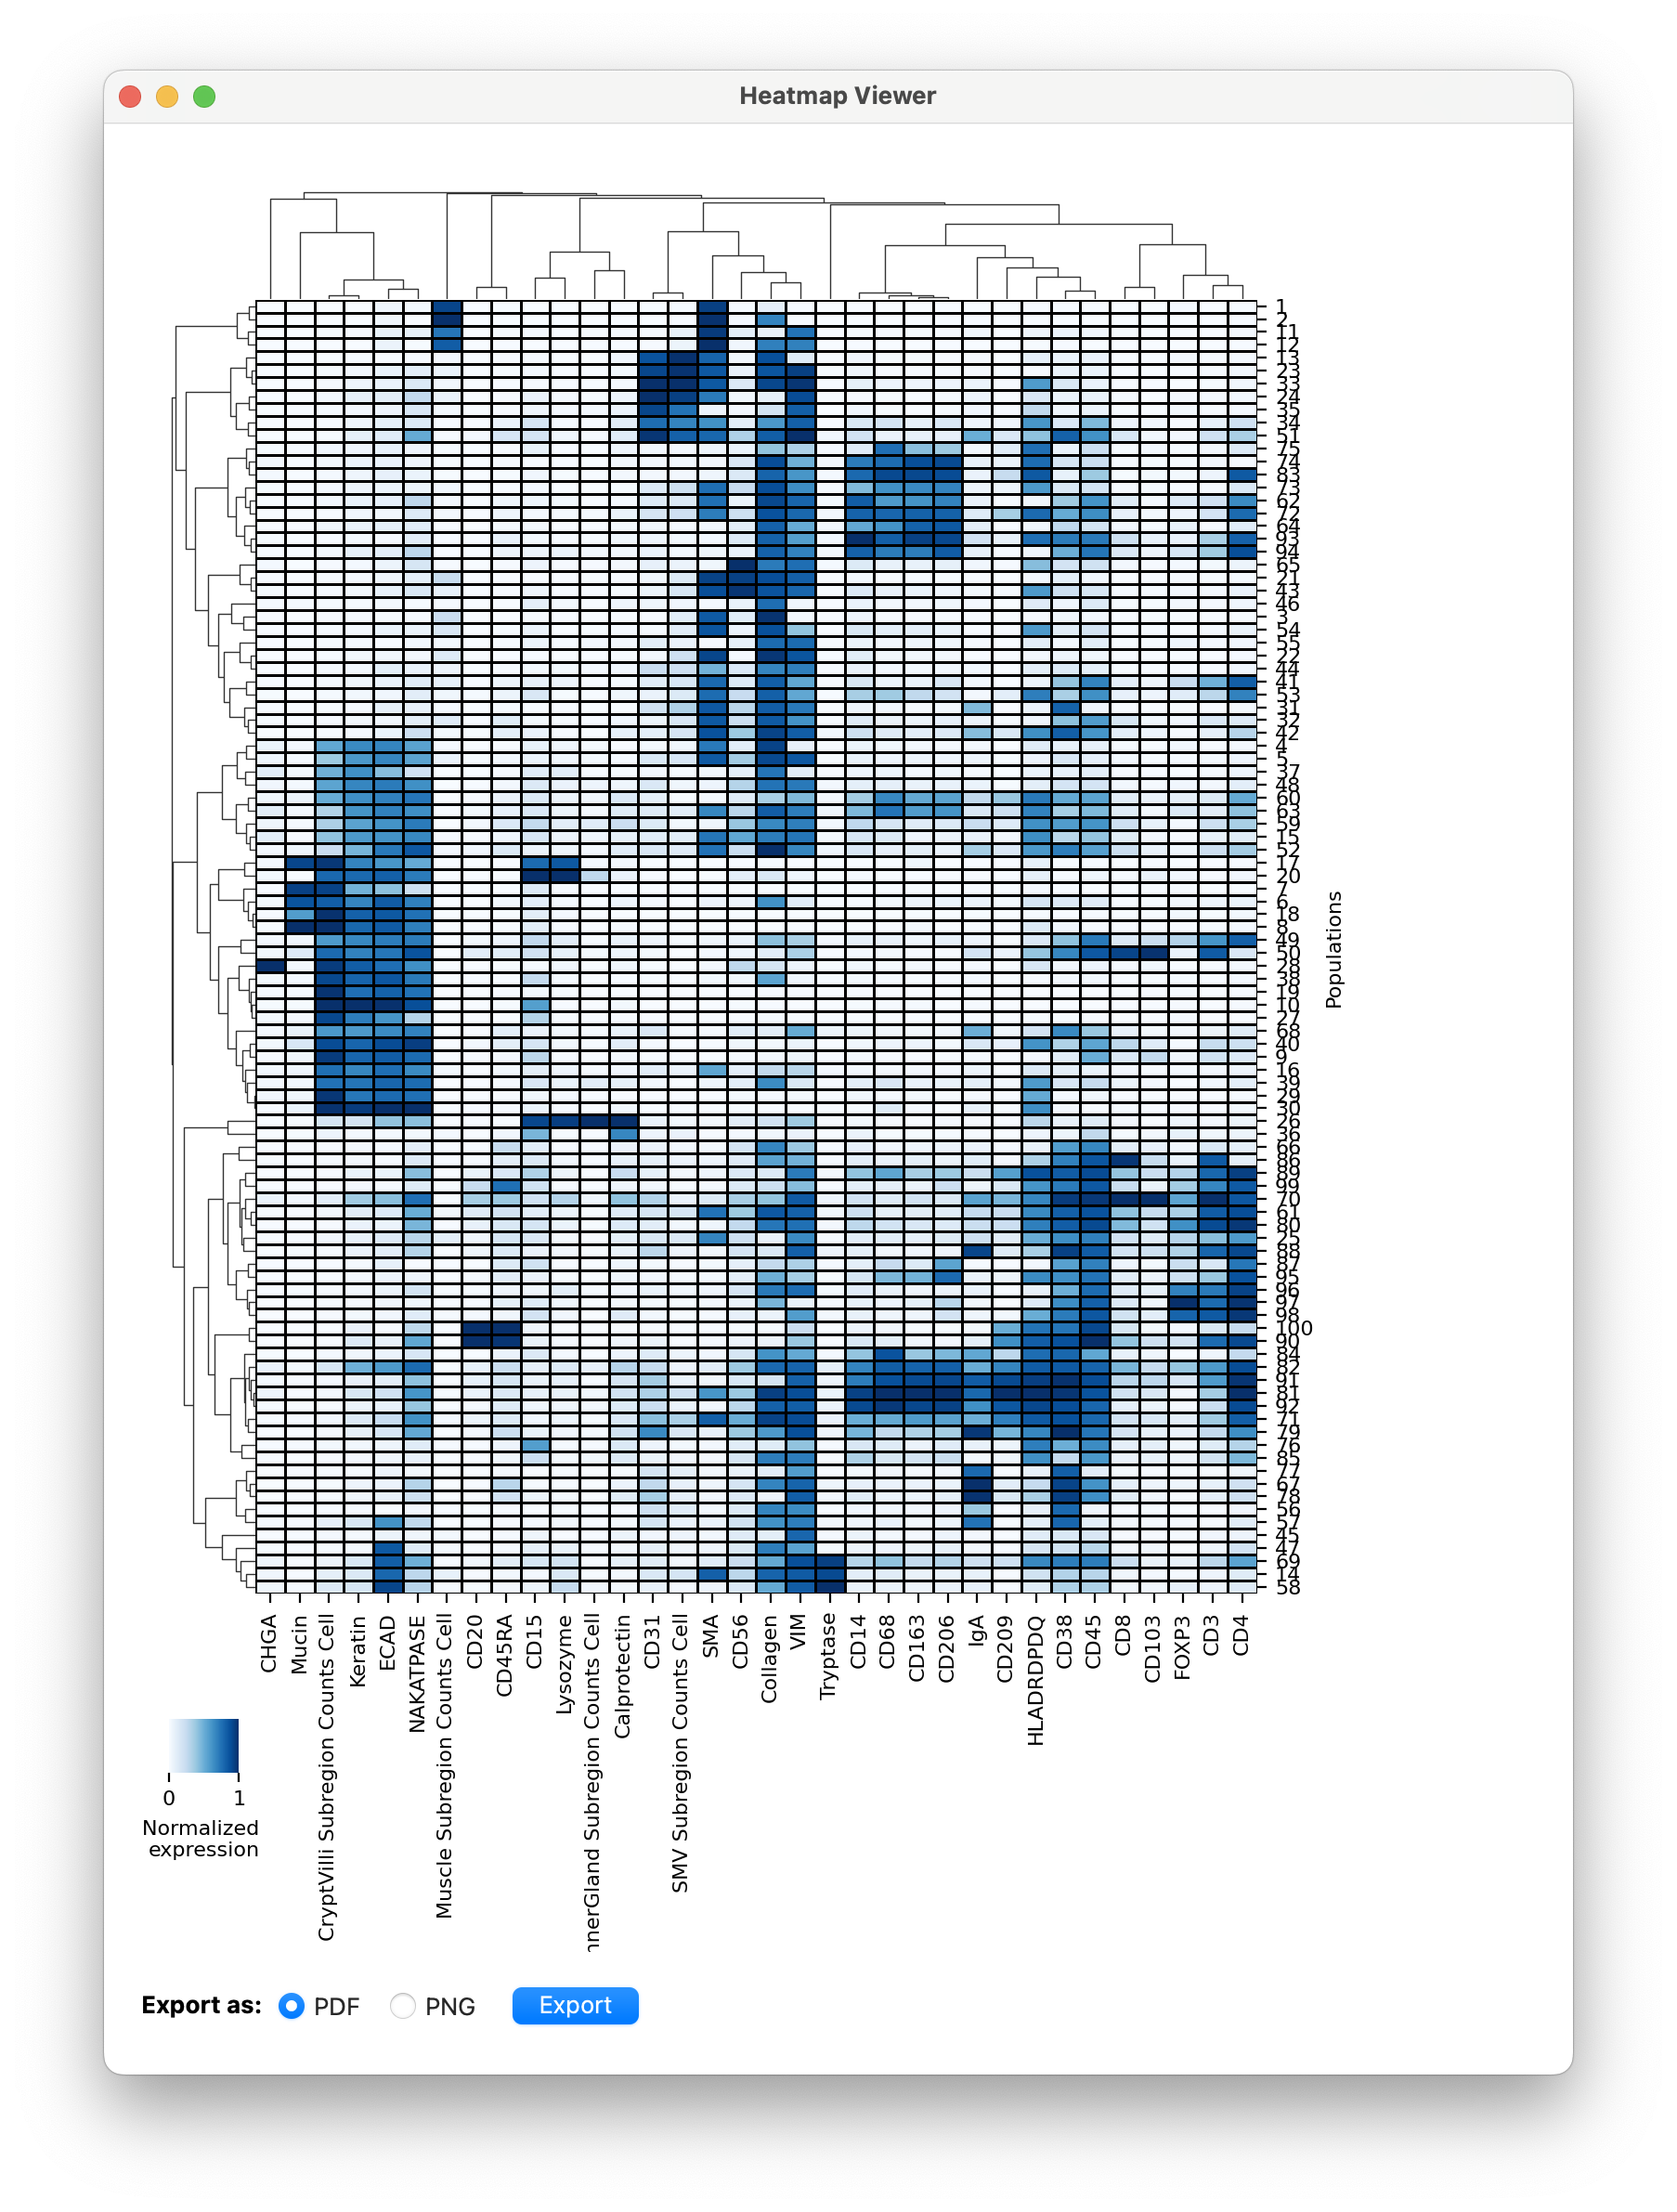
This heatmap can be utilized in several ways:
- As a guide for filling in the CellTypeTable and verifying that you didn’t miss any celltypes.
- Inspecting which proteins are often co-expressed on cells by following the hierarchical clustering. This can lead to new insights into your specific dataset.
- Selecting clusters to sample from for landmarking specific celltypes. See clustering-based landmarking tutorial.